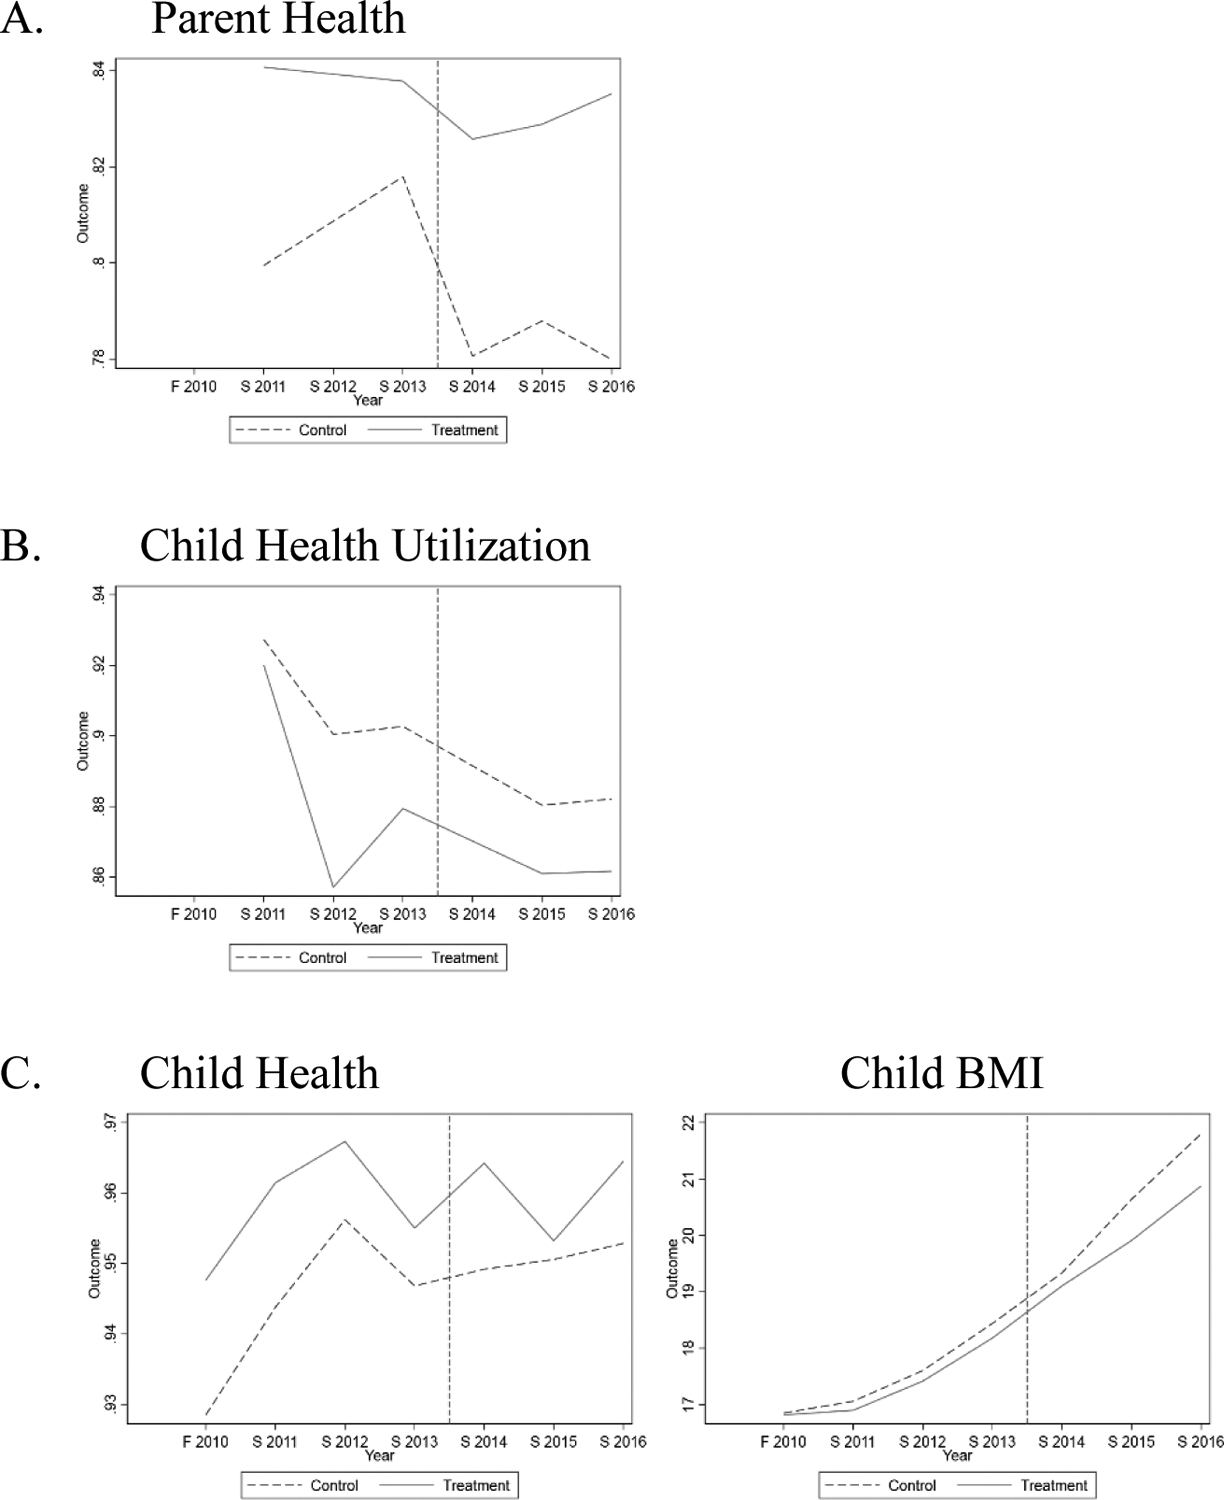
Figure 1.

Raw Trends in Variables of Interest
Notes: Data from ECLS:K 2011. Expansion states are the treatment states, and non-expansion states are the control states. The x-axis (Year) represents the survey wave, F=fall and S=spring. The vertical line represents January 2014, when the ACA Medicaid expansions were largely implemented. Sample is limited to children in households with incomes below 138% FPL. Parent health and child health utilization were not available in the F 2010 wave of data collection.
