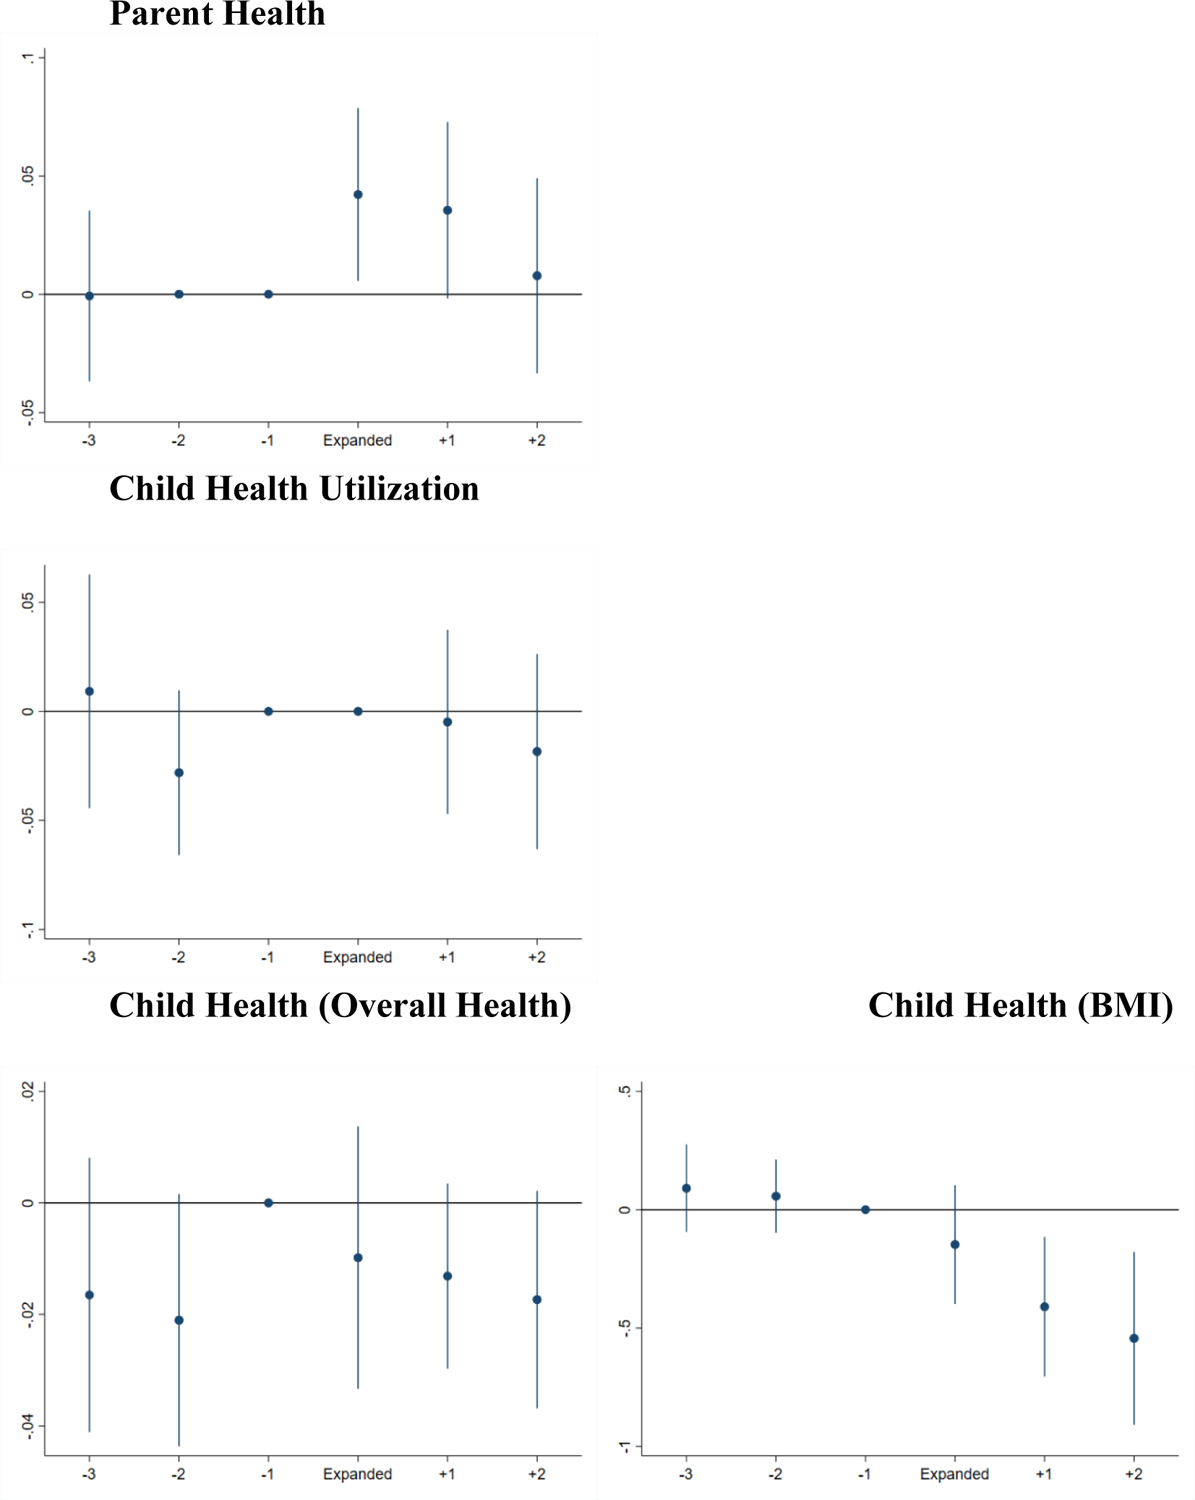
Figure 2.

Event-Study Graphs
Notes: Each bar represents the 95 percent confidence internal (constructed with standard errors clustered at the state level), and the center of the bar represents the point estimate. The coefficient for the group “−1” (i.e. the one year prior to the Medicaid expansion) is normalized to zero. Similarly, coefficients for years in which the outcome is not measured in the sample is also reported as zero. Sample is limited to children in households with incomes below 138% FPL.
