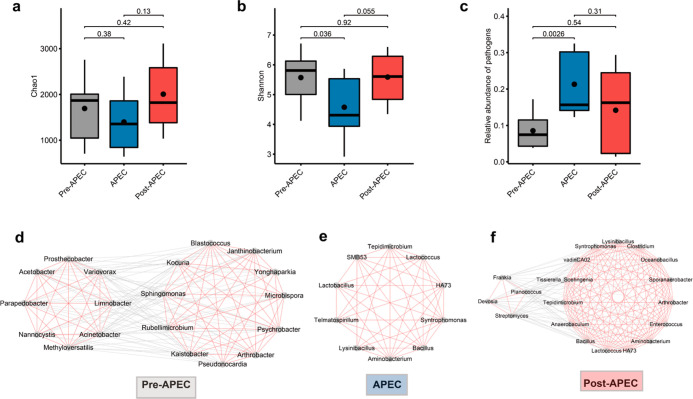
Figure 2.
Airborne bacterial communities in the APEC summit-related samples. The Chao1 index (a) and Shannon index (b) of the pre-APEC, during APEC, and post-APEC summit samples. The p-values of Wilcoxon rank-sum test results are shown above the boxes. (c) Relative abundance of potential pathogens in pre-APEC, during APEC, and post-APEC summit samples. The hub co-occurrence network in the pre-APEC (d), during APEC (e), and post-APEC (f) summit samples. Red line: positive correlation and gray line: negative correlation.

