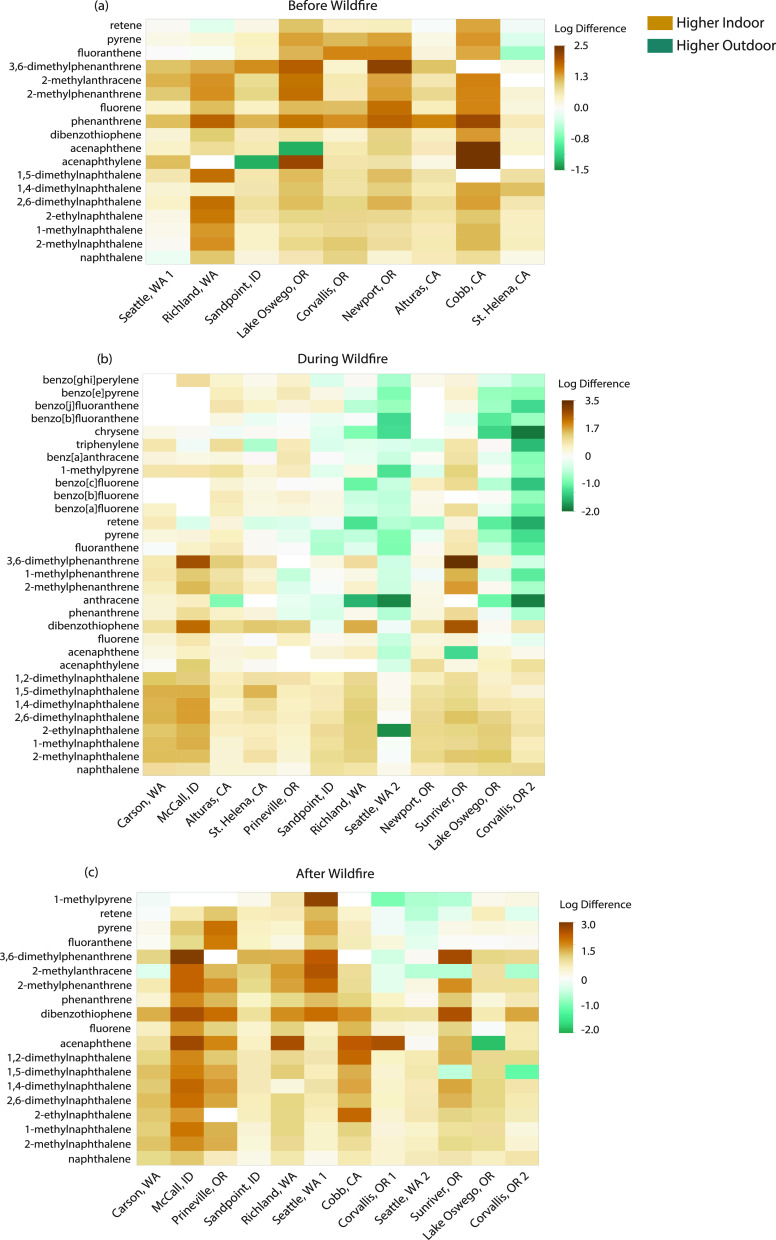
Figure 2.
Heat map of indoor–outdoor vapor-phase PAH concentrations (a) before, (b) during, and (c) after wildfires. Air concentrations were first log-transformed and then subtracted. Only PAHs detected in at least 75% of samples are included. Shades of yellow represent higher PAH concentrations indoors, while shades of blue represent higher PAH air concentrations outdoors.

