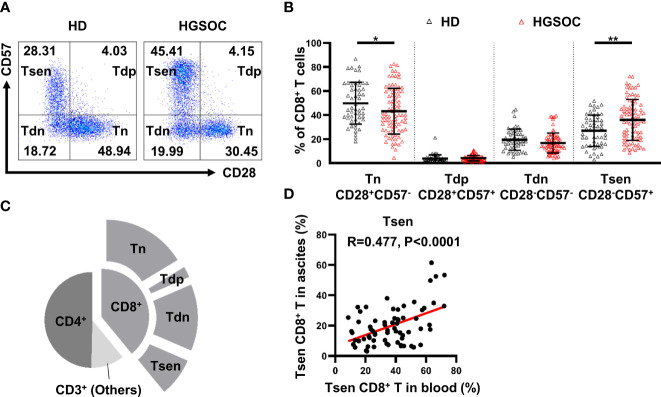
Figure 1.
CD28−CD57+CD8+ T cells are present in the peripheral blood and ascites from untreated patients with HGSOC. (A) Representative flow cytometry plots are presented for CD28 and CD57 expression by CD8+ T cells in the peripheral blood of healthy donors (HDs, n = 53) and patients with high-grade serous ovarian cancer (HGSOC, n = 86). Values in plots represent percentages. (B) Proportion of CD8+ T-cell subsets: CD28+CD57− (Tn), CD28+CD57+ (Tdp), CD28−CD57− (Tdn), and CD28−CD57+ (Tsen). Groups were compared using t-test (Tsen) or Mann–Whitney U-test (Tn, Tdp, and Tdn). Bars show mean with SD. (C) Proportion of CD4+ and CD8+ subsets within CD3+ population in ascites (n = 68). (D) The correlation between the frequency of Tsen CD8+ T cells in the peripheral blood and ascites from the same patient with HGSOC (n = 68) was analyzed by Spearman’s rank coefficient. HD, healthy donors; HGSOC, high-grade serous ovarian cancer. *, P < 0.05; **, P < 0.01.

