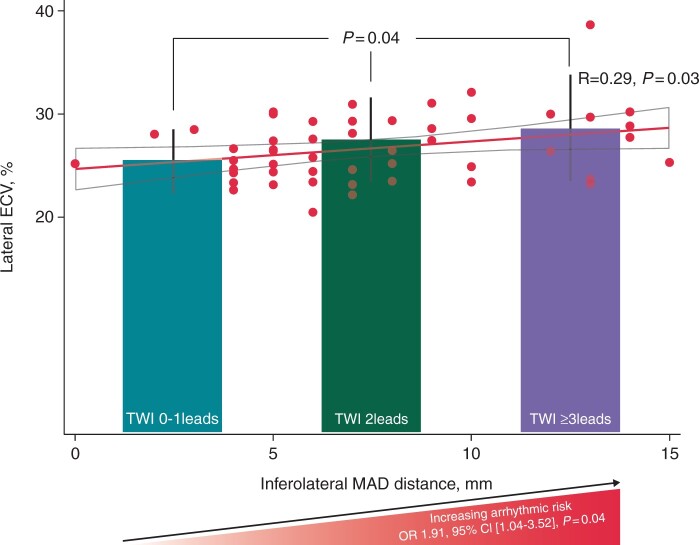
Graphical Abstract.
Higher number of ECG leads with TWI indicating higher arrhythmic risk and higher degree of lateral diffuse myocardial fibrosis Bar charts show values of lateral ECV by T1-mapping CMR in patients with no TWI or with TWI in 1 lead (left bar), in patients with TWI in 2 ECG leads (middle bar) and in patients with TWI in ≥3 ECG leads. P value was obtained by one-way ANOVA test with Bonferroni correction. The scatter plot graph shows the correlation between lateral ECV by T1-mapping CMR and inferolateral MAD distance. Inferolateral MAD distance increased with higher lateral ECV values. Correlation coefficient R and P values were calculated by Pearson correlation test. The risk of severe VA increased with the number of ECG leads with TWI. Odds ratios, 95% CI and P value for risk of severe VA were calculated by logistic regression analysis. CMR = cardiac magnetic resonance, ECG = electrocardiographic, ECV = extracellular volume, MAD = mitral annulus disjunction, TWI = T-wave inversion VA = ventricular arrhythmias.

