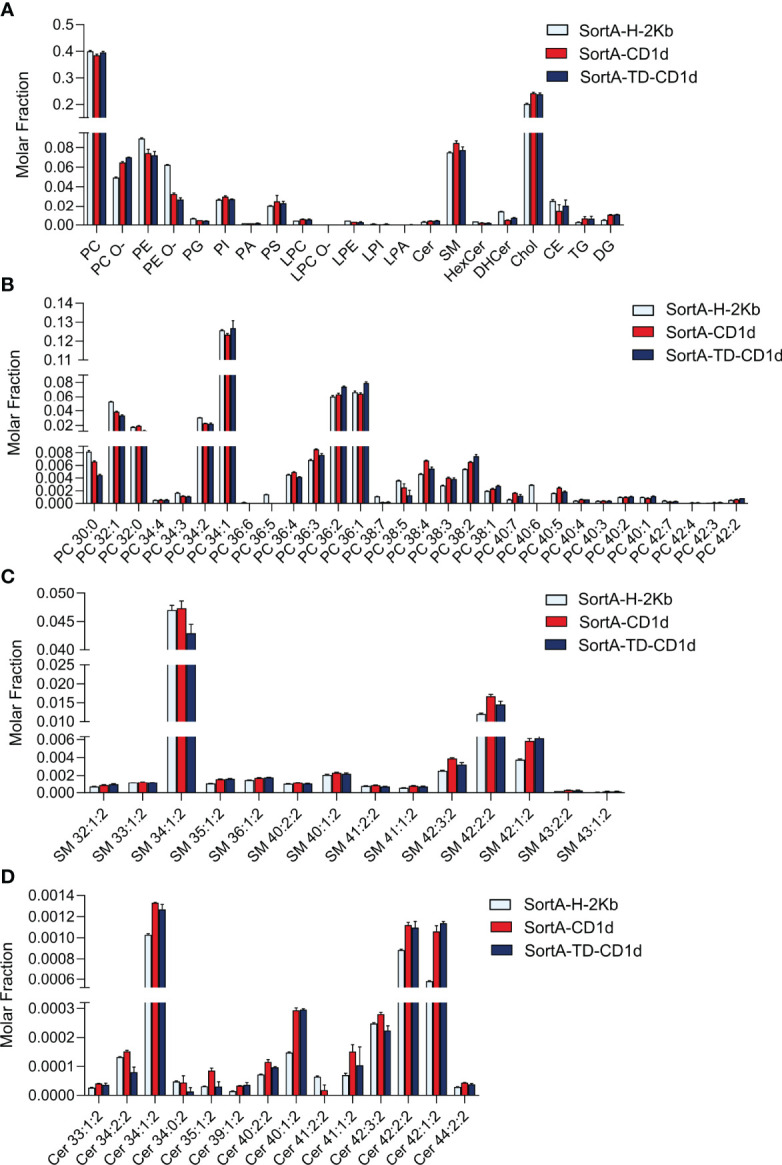
Figure 6.

Comparative total cellular lipid profiles of L cells expressing CD1d, CD1d-TD or H2Kb. Total cellular lipids derived from L cells stably transfected with SortA-CD1d, SortA-TD-CD1d and SortA-H-2Kb were analyzed using shotgun lipidomics. Lipid classes (A) and lipid species from (B) PC, (C) SM and (D) Cer) are expressed as molar fraction (pmol lipid per pmol total lipids) with error bars indicating mean ± SEM. Statistics: Kruskal-Wallis, multi-test correction of p values was performed using the Benjamini-Hochberg correction. No significant differences in lipid abundance between cells expressing Sort-H-2Kb, SortA-CD1d and SortA-TD-CD1d were observed.
