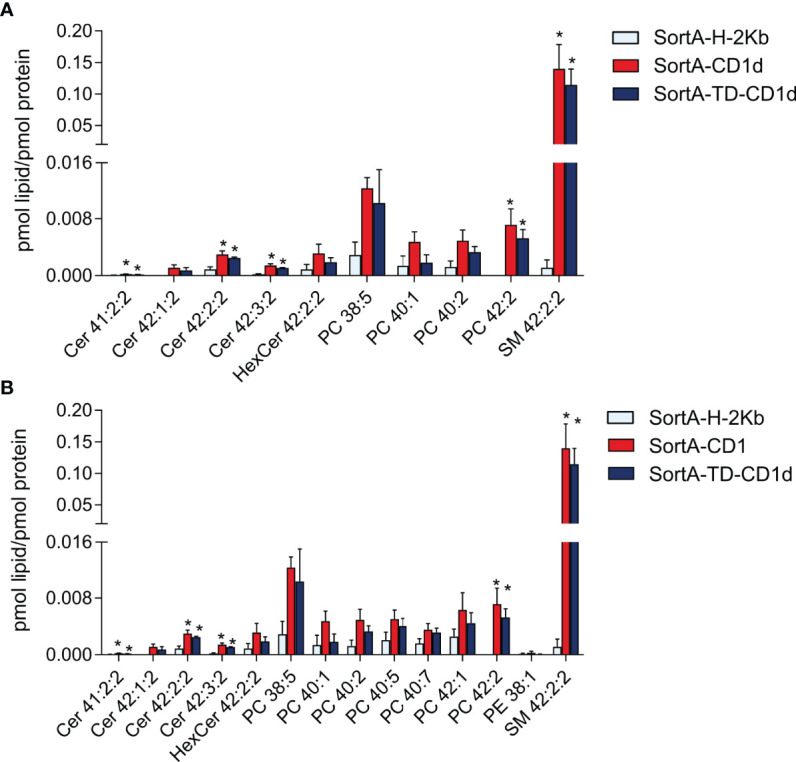
Figure 7.

Lipids associated with SortA-CD1d and SortA-CD1d-TD. SortA-CD1d, SortA-TD-CD1d, and SortA-H-2Kb were purified as described in Methods and subjected to shotgun lipidomics. Only lipids identified in 3 of 4 independent experiments and showing (A) at least three -fold higher or (B) at least two-fold higher abundance in SortA-CD1d- or SortA-TD-CD1d purifications compared to SortA-H-2Kb purifications are shown. Lipid abundance is expressed as pmol lipid per pmol of the respective protein with error bars indicating mean ± SEM. Statistics: Kruskal-Wallis followed by Dunn´s post-hoc test, p-value * < 0.05; Asterisks indicate significance in the Dunn´s post-hoc test of a comparison of the group indicated by asterisk (SortA-CD1d or SortA-TD-CD1d) compared to SortA-H-2Kb.
