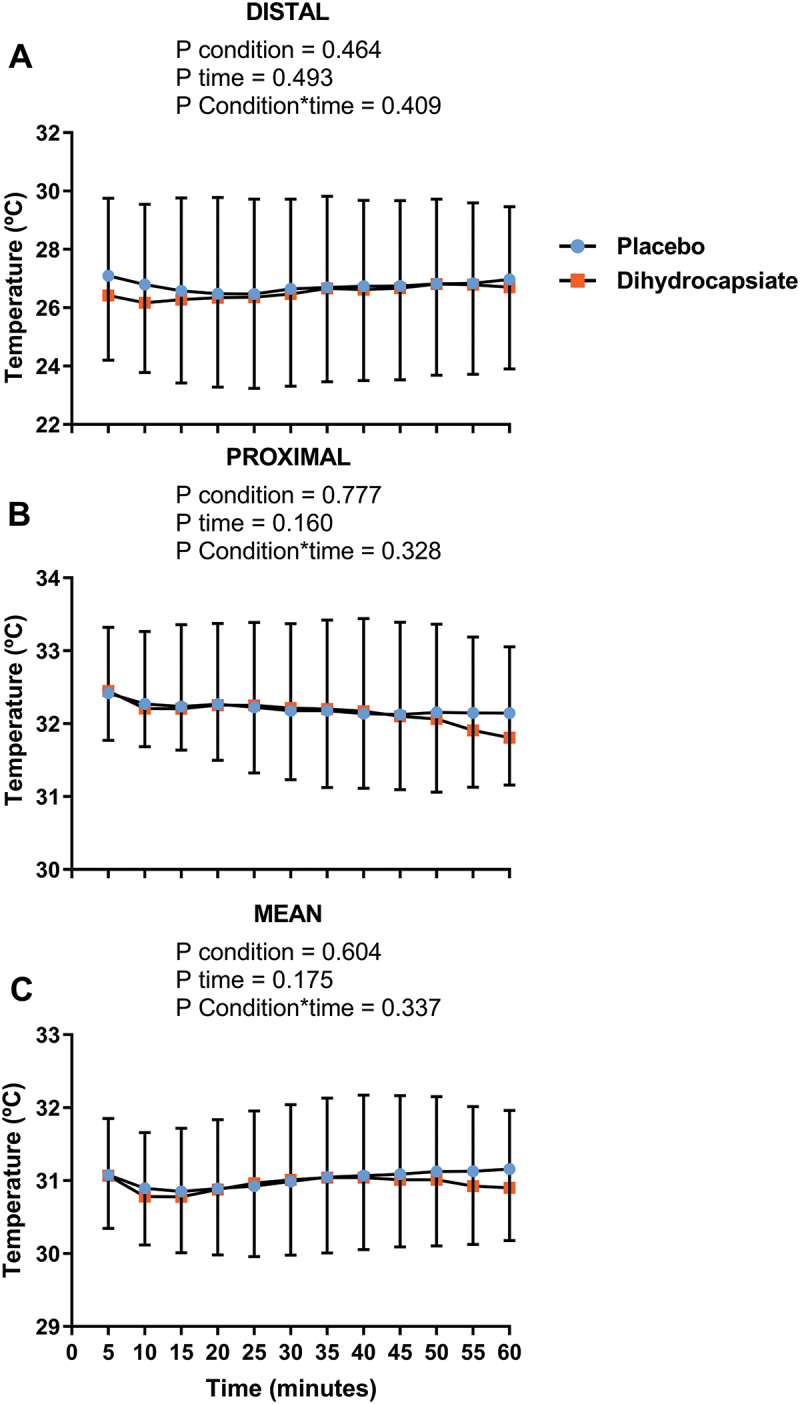
Figure 3.

Effects of dihydrocapsiate ingestion on skin temperature during aerobic exercise at FATmax intensity in men with overweight/obesity. Panels A, B, and C respectively show the mean values at each time point of distal (n = 22), proximal (n = 17), and mean (n = 18) skin temperatures during exercise in the placebo vs. dihydrocapsiate condition. Each single point (blue) or square (Orange) represents the mean value of each 5 min period. P values from linear mixed model analyses.
