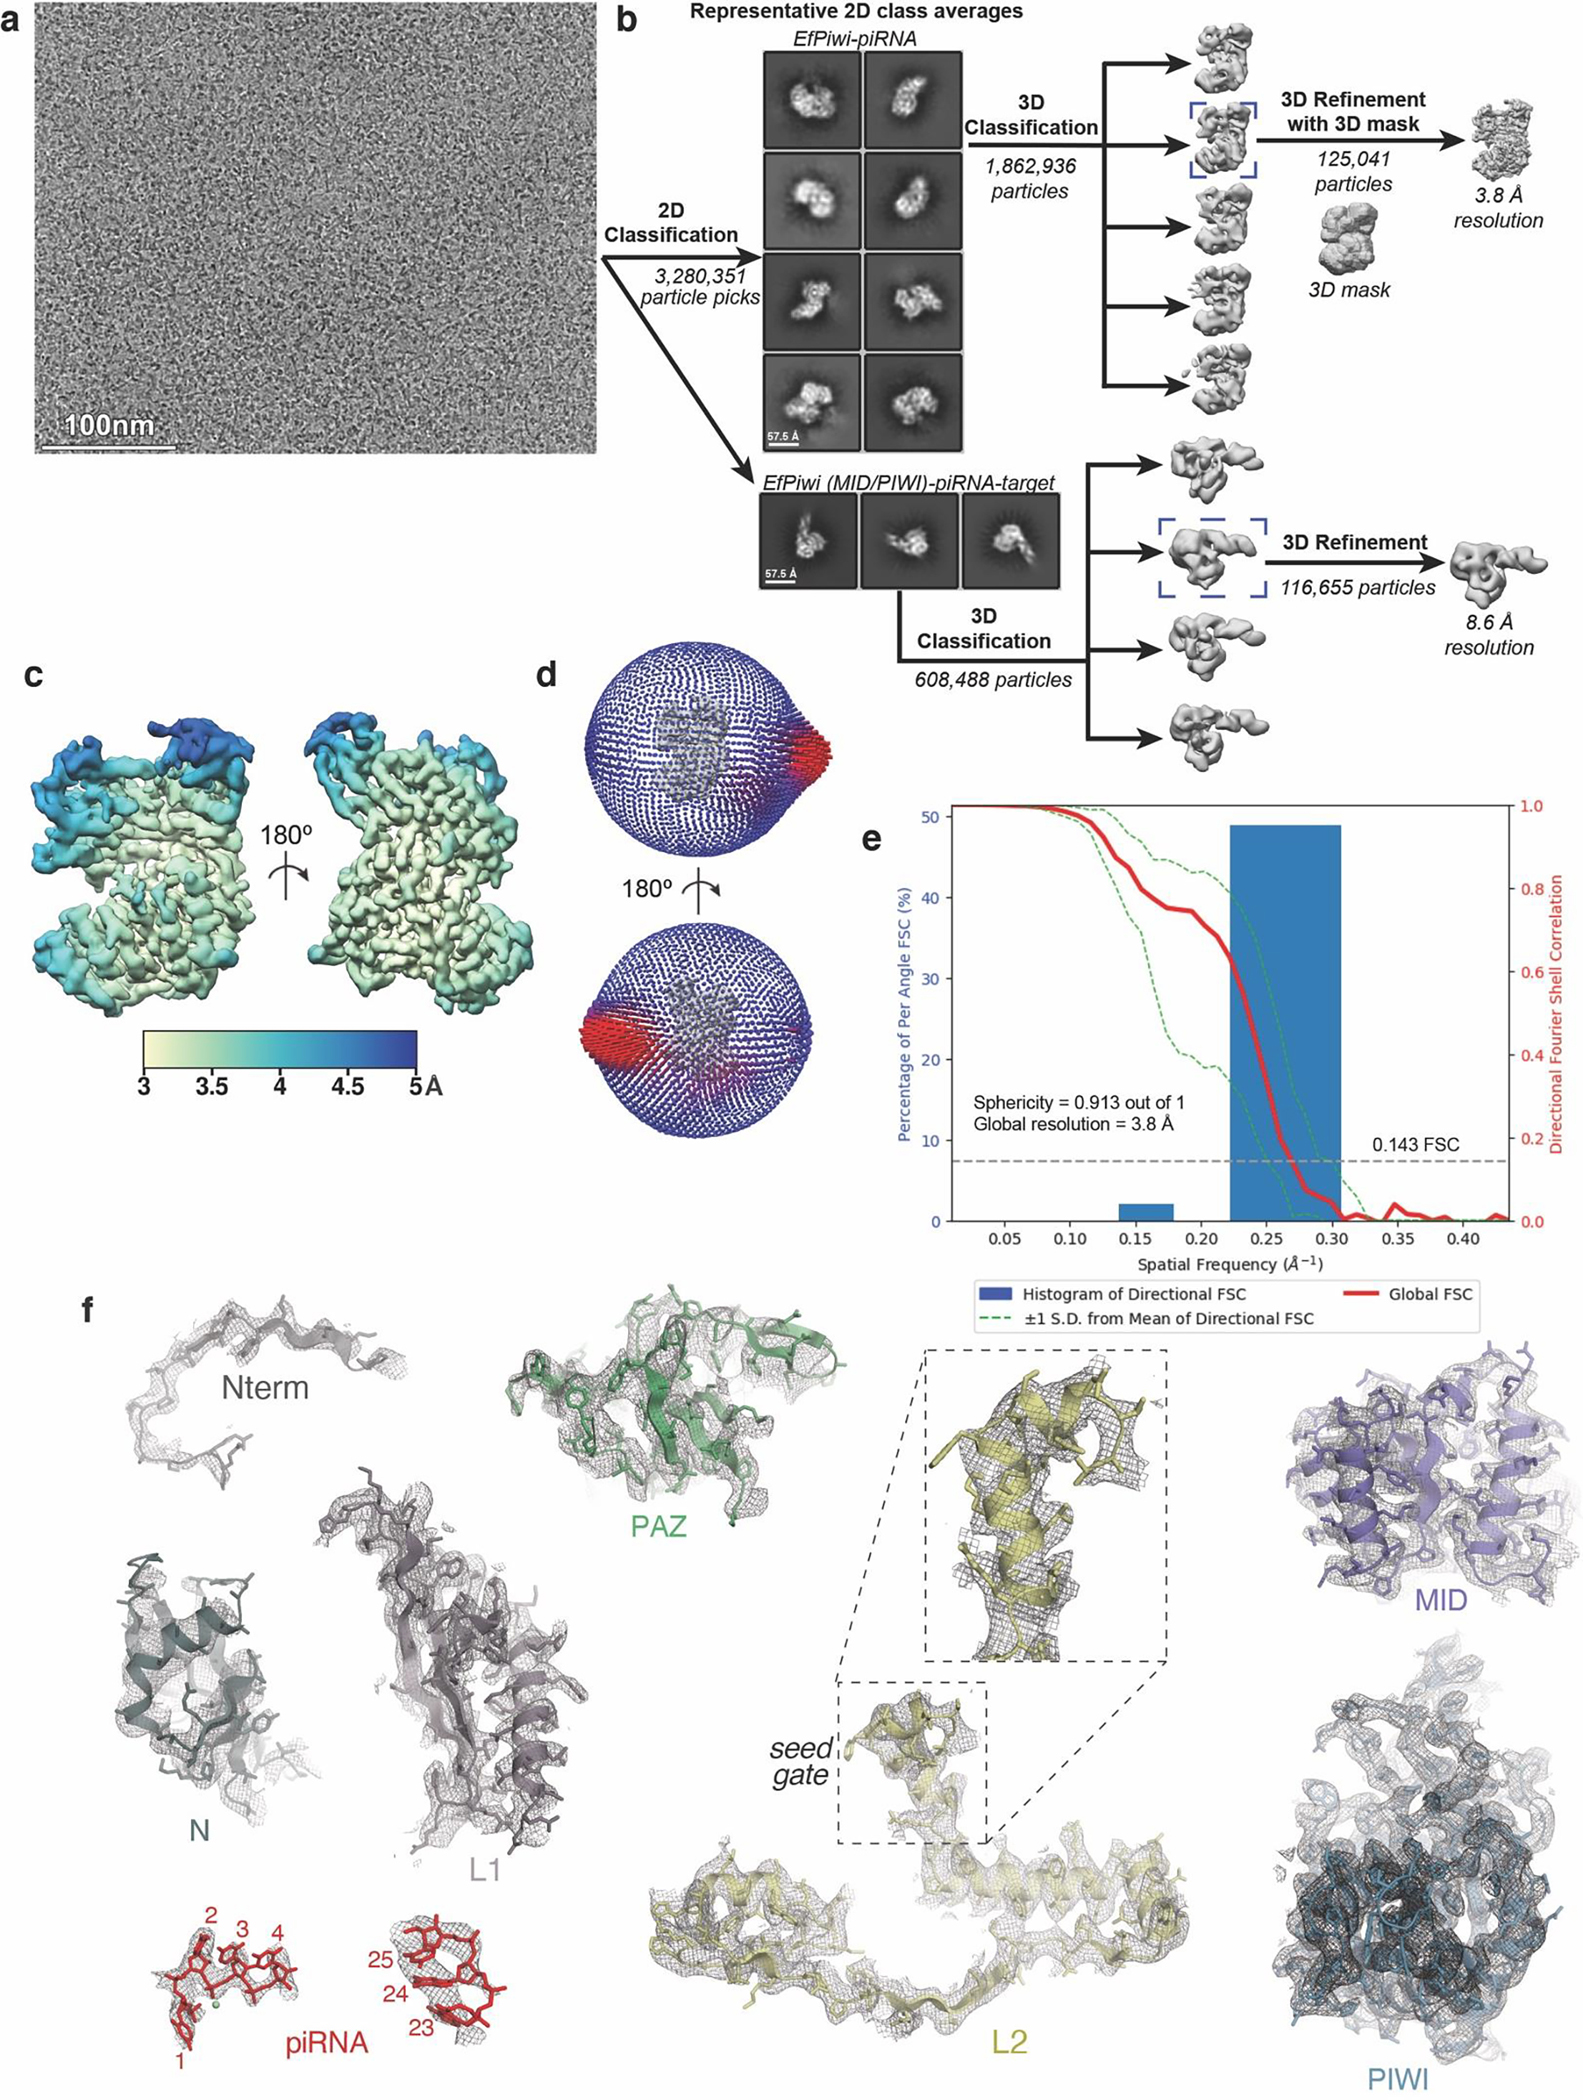
Extended Data Fig. 2. Imaging and processing of the EfPiwi-piRNA complex (and EfPiwi-piRNA-long target complex).

a, Representative cryo-EM micrograph (1,765 micrographs collected in total). Input sample contained EfPiwi-piRNA and a long target RNA (complementary to piRNA nucleotides g2–g25). b, Cryo-EM data processing workflow. The data set contained two populations of well resolved particles, one for the binary EfPiwi-piRNA complex and another for the ternary EfPiwi-piRNA-long target complex. Particles isolated from micrographs were sorted by reference-free 2D classification. Only particles containing high-resolution features for the intact complex were selected for downstream processing. 3D classification was used to further remove low-resolution or damaged particles, and the remaining particles were refined to obtain a 3.8 Å reconstruction for the EfPiwi-guide complex, and 8.6 Å for the ternary EfPiwi-piRNA-long target complex. c, The final 3D map for the EfPiwi-piRNA complex colored by local resolution values, where the majority of the map was resolved between 3.5 Å and 4 Å with the flexible PAZ and N domains having lower resolution. d, Angular distribution plot showing the Euler angle distribution of the EfPiwi-piRNA particles in the final reconstruction. The position of each cylinder corresponds to the 3D angular assignments and their height and color (blue to red) corresponds to the number of particles in that angular orientation. e, Directional Fourier Shell Correlation (FSC) plot representing 3D resolution anisotropy in the reconstructed map, with the red line showing the global FSC, green dashed lines correspond to ±1 standard deviation from mean of directional resolutions, and the blue histograms correspond to percentage of directional resolution over the 3D FSC. F. EM density quality of EfPiwi-piRNA complex. Individual domains of EfPiwi fit into the EM density, EM density shown in mesh; molecular models (colored as in Fig. 2) shown in cartoon representation with side chains shown as sticks; piRNA shown in stick representation.
