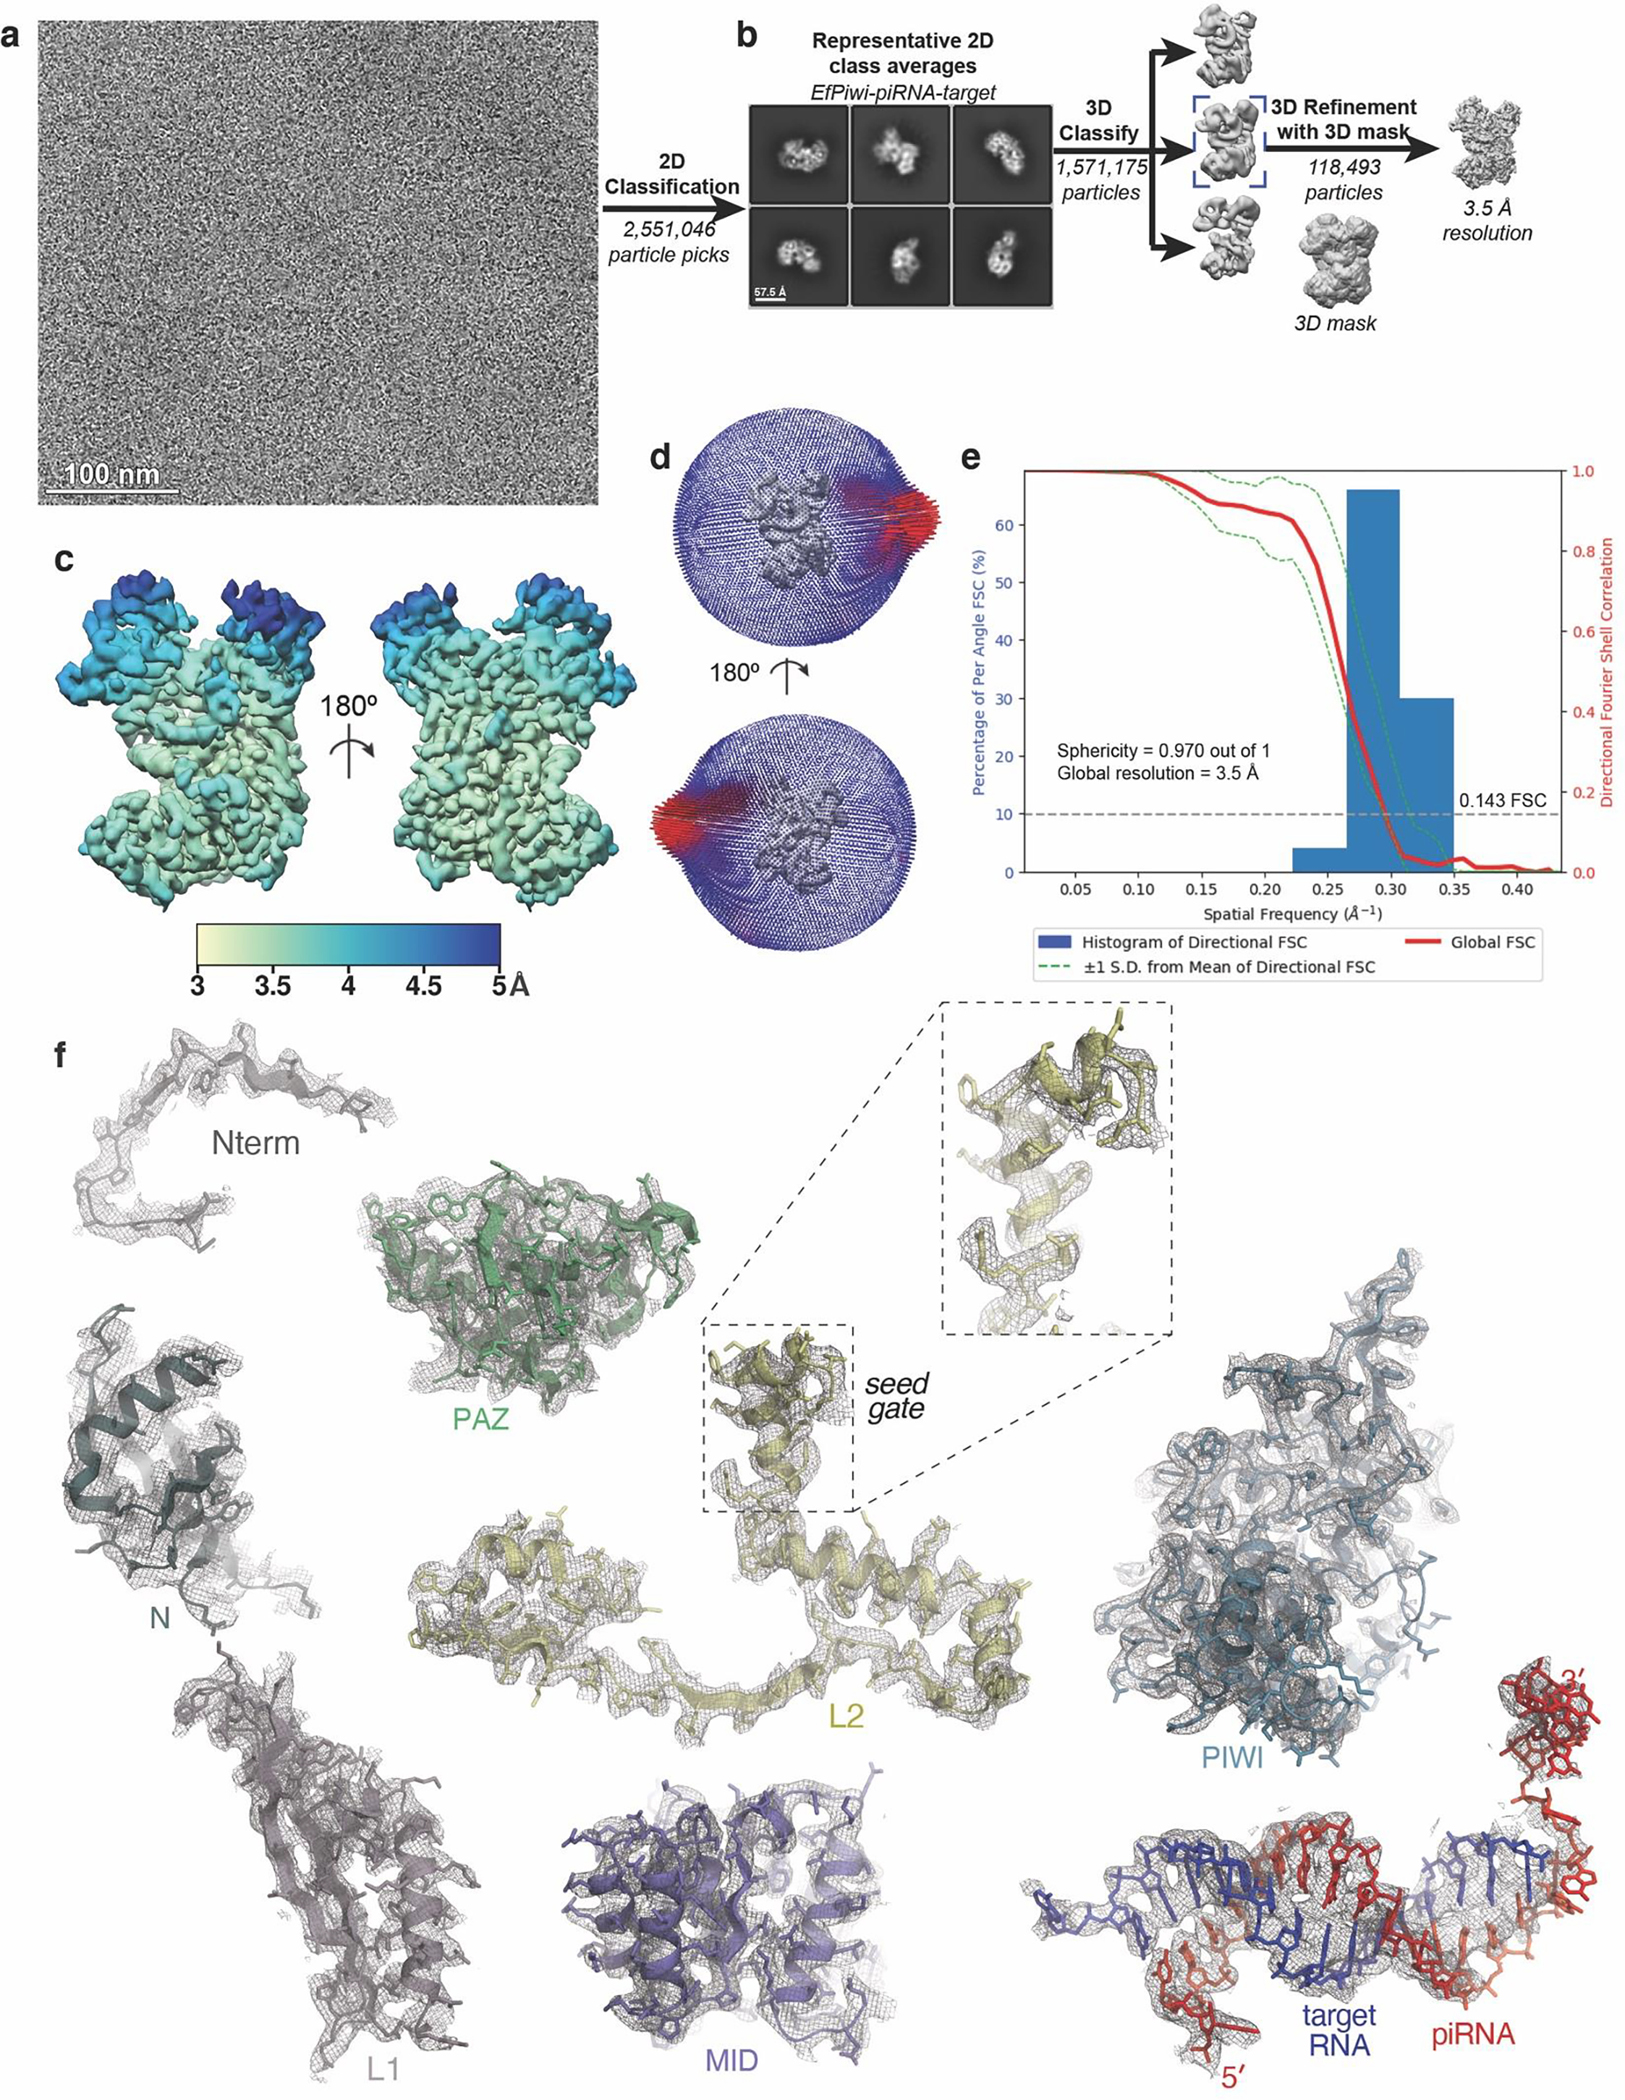
Extended Data Fig. 5. Imaging and processing of the EfPiwi-piRNA-target complex.

a, Representative cryo-EM micrograph of EfPiwi-piRNA-target complex (1,881 micrographs collected in total). b, Workflow for processing EfPiwi-piRNA-target complex data set. Particles isolated from micrographs were sorted by reference-free 2D classification. Only particles containing high-resolution features for the intact complex were selected for downstream processing. 3D classification was used to further remove low-resolution or damaged particles, and the remaining particles were refined to obtain a 3.5 Å map. c, The EfPiwi-piRNA-target complex map colored by local resolution. d, Euler angle distribution plot for the EfPiwi-piRNA-target complex particles. e, Directional Fourier Shell Correlation (FSC) plot representing 3D resolution anisotropy in the reconstructed map. Red line shows global FSC; green dashed lines ±1 standard deviation from mean of directional resolutions; blue histograms indicate percentage of directional resolution over the 3D FSC. f, EM density quality of EfPiwi-piRNA-target complex. Individual domains of EfPiwi and RNAs fit into the EM density; EM density shown in mesh; protein models shown in cartoon representation (colored as in Fig. 5) with side chains shown as sticks; RNAs shown in stick representation.
