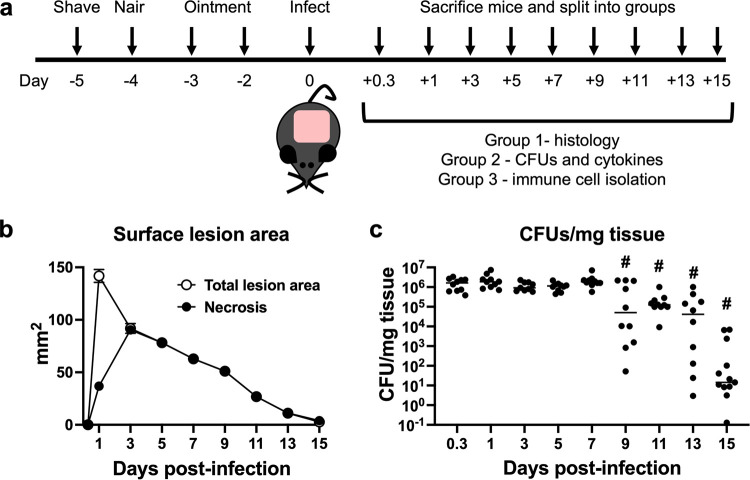
FIG 1.
Kinetic macroscopic tissue damage and bacterial titer enumeration over the course of infection. (a) Schematic of the experimental design. (b) Mice were imaged, and the total lesion size (blanching and necrosis) and surface necrosis area were measured using ImageJ. Data represent the means with standard errors of the means (SEM) (n = 21 to 186). Errors bars are present and may be smaller than the symbols. (c) Bacterial titers were determined. Each symbol represents the value for a single animal (n = 10 to 13), and the line represents the median value. “#” indicates a P value of <0.05 by a Mann-Whitney test compared to 0.3 dpi.

