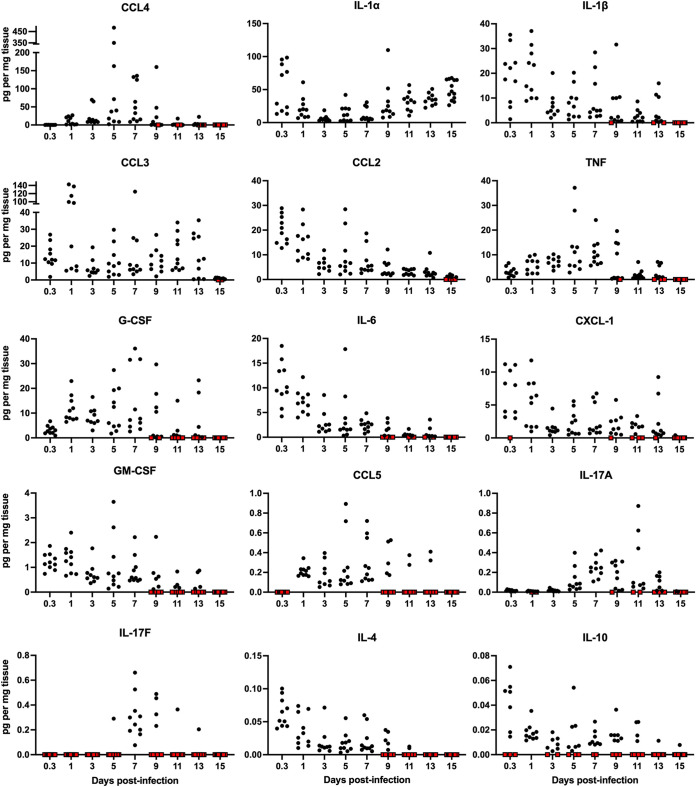
FIG 3.
Cytokines and chemokines detected in the skin during S. aureus infection. The indicated cytokines and chemokines were quantified by cytometric bead arrays. Each symbol represents the value for an individual mouse (n = 9 to 13). Red symbols represent samples whose cytokine/chemokine values were below the limit of detection.

