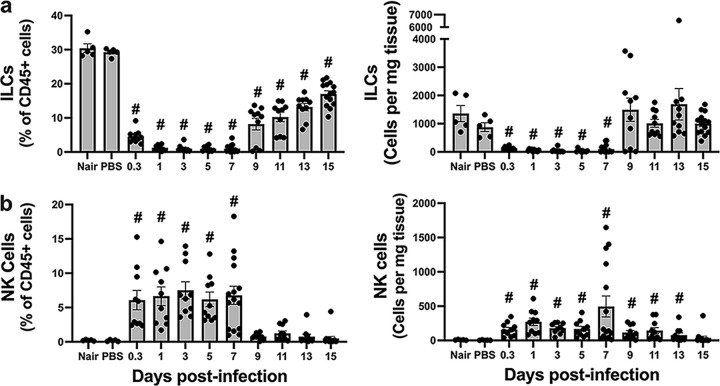
FIG 6.
Dynamics of the innate lymphoid cell response at the site of infection. Single-cell suspensions derived from skin homogenates from control mice (Nair and PBS) or infected mice isolated at each time point were analyzed to determine the percentages and numbers of ILCs (B220− GR1− CD11b− CD11c− CD3− NK1.1− CD90+) (a) and NK cells (CD3− NK1.1+) (b). Each symbol represents the value for one mouse. The bars represent the means with SEM (n = 5 to 15 mice/group). “#” indicates a P value of <0.05 by a Mann-Whitney test relative to PBS.

