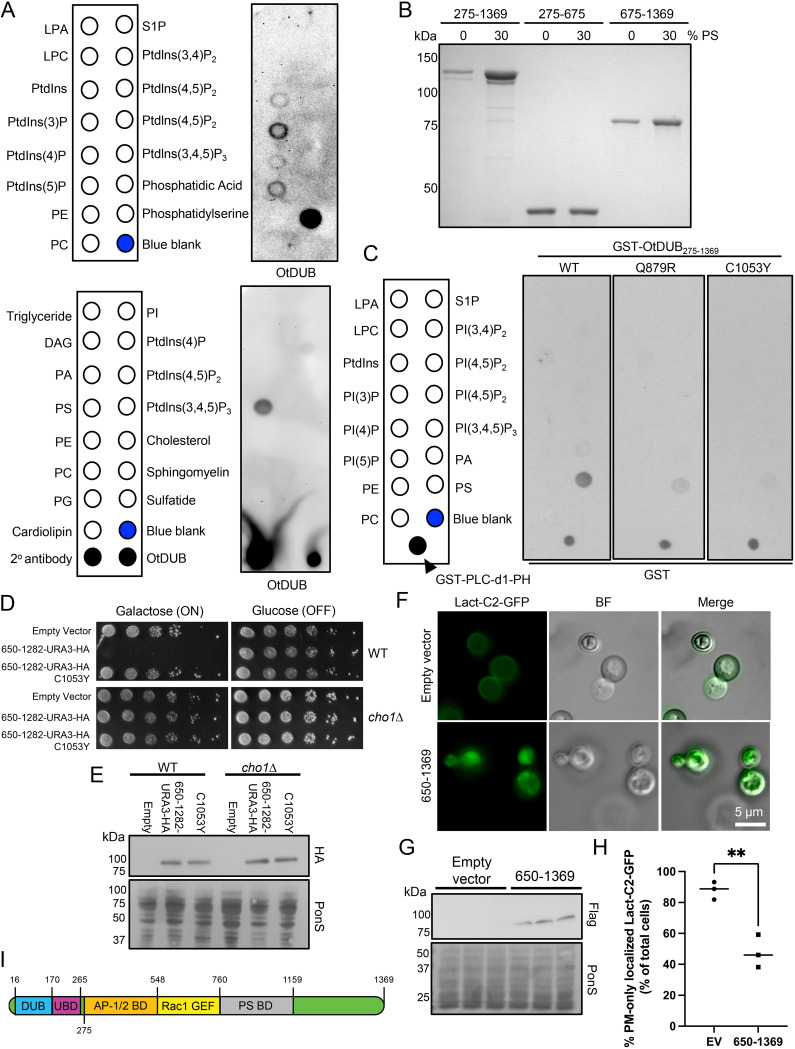
FIG 5.
OtDUB binds phosphatidylserine and binding involves residues also required for membrane trafficking defects. (A) Protein-lipid overlay screening was performed on commercially available hydrophobic membranes spotted with the indicated lipids by adding 0.5 μg/mL of recombinant OtDUBC135A-Flag followed by immunoblotting for OtDUB with anti-OtDUB antibodies (n = 1). As positive controls, one membrane was spotted with 1 μL of secondary antibody and with 100 ng of OtDUBC135A-Flag. (B) Liposome sedimentation assay pellets from liposomes containing 0% or 30% phosphatidylserine (PS) incubated with 4 μM the indicated recombinant OtDUB polypeptide fragments were resolved by SDS-PAGE and stained (n = 3). (C) Protein-lipid overlays were carried out using 2 μg/mL of the indicated GST-OtDUB275–1369 variants followed by immunoblotting with anti-GST antibodies (n = 1). As a positive control, 500 pg of GST-PLC-d1-PH protein were spotted on each membrane. (D) WT or cho1Δ transformants carrying p415GAL1, p415GAL1-OtDUB650–1282, or p415GAL1-OtDUB650–1282-C1053Y were serially diluted and plated on minimal media lacking leucine and supplemented with choline and ethanolamine, and containing either glucose or galactose. Cells were grown at 30°C for 2–6 days (n = 3). (E) Transformants from panel D grown in galactose were used to make extracts from 0.25 OD600 units; proteins were analyzed by anti-HA immunoblotting. Ponceau S staining was used for loading comparison (n = 1). (F) Epifluorescence images of the PS biosensor Lact-C2-GFP after galactose induced expression of OtDUB650–1369 or empty vector. (G) The three transformants used for panels F and H were cultured to make extracts, and 0.25 OD600 units of cells were analyzed by anti-Flag immunoblotting. Ponceau S staining was used for loading comparison. (H) Quantification of yeast strains used in panel F. Each data point represents quantification from an independent transformant, 32–45 cells counted per transformant. (112 total control cells 143 total cells expressing OtDUB650–1369). Horizontal bars represent the mean. **, P < 0.01, by Student’s t test. (I) Cartoon representation of OtDUB with current boundaries mapped for each known functional domain. The exact boundaries of AP-1/2BD and the N-terminal boundary of PS-BD remain unknown. BF, bright field; EV, empty vector; DAG, diacylglycerol; LPA, lysophosphatidic acid; LPC, lysophosphatidylcholine; PA, phosphatidic acid; PE, phosphatidylethanolamine; PC, phosphatidylcholine; PS, phosphatidylserine; PG, phosphatidylglycerol; PI, phosphatidylinositol; SP-1, sphingosine-1-phosphate; PtdIn(x)P, phosphatidylinositol (X) phosphate.

