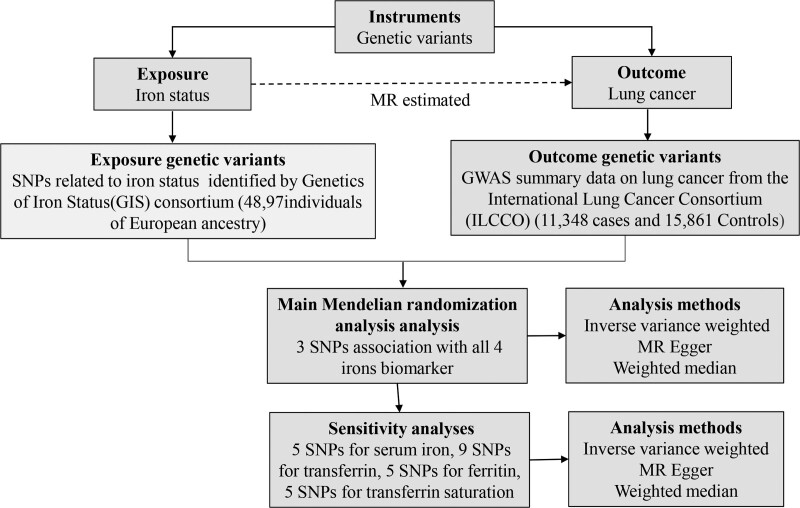
Figure 1.
Data sources and analysis plan used in the 2-sample Mendelian randomization analysis. A summary of SNP phenotypes was obtained from publicly available GWAS databases. Three SNPs associated with all 4 iron biomarkers (increased ferritin, serum iron, transferrin saturation, and decreased transferrin) were used in the main MR analysis. SNPs affiliated with at least one of the iron markers (5 SNPs for serum iron, 9 SNPs for transferrin, 5 SNPs for ferritin, and 5 SNPs for transferrin saturation) were used in the sensitivity analysis. MR, Mendelian randomization; SNP, single nucleotide polymorphism; MR Egger, Mendelian randomization–Egger regression method.

