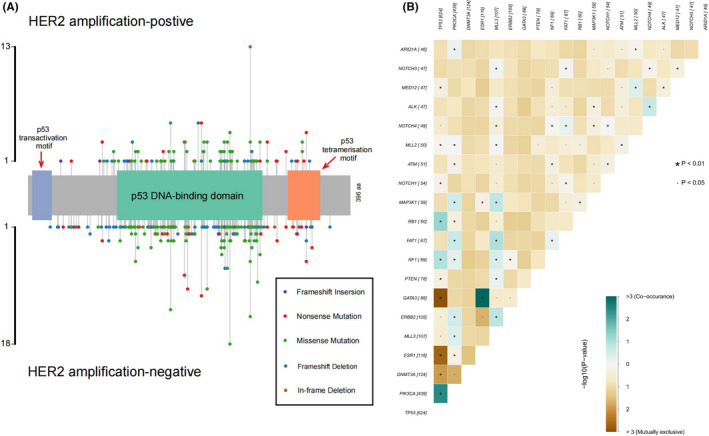
FIGURE 2.

Lollipop and somatic interaction plots of TP53. (A) Lollipop plot of TP53. There was no obvious mutation hotspot in TP53; mutation sites were mostly concentrated in the DNA‐binding domain, accounting for 84.9% (567/668). There was no significant difference in mutation sites between HER2‐amplified and HER2‐nonamplified populations. NCBI Reference Sequence: NM_000546.5, TP53 transcript variant 1. (B) Somatic interactions of TP53 mutations. In the top 20 most common genes, TP53 mutations co‐occurred with mutations in PIK3CA, RB1, and NF1 and were mutually exclusive with mutations in GATA3, ESR1, DNMT3A, MED12, PTEN, NOTCH4, ERBB2, and MLL3 (p < 0.05)
