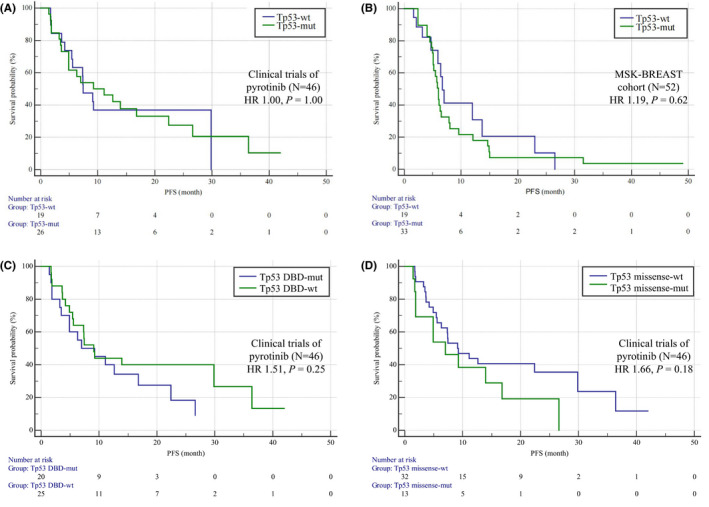
FIGURE 3.

Kaplan–Meier curves of PFS for HER2 TKIs in HER2 amplification‐positive patients. (A) Comparison of PFS between patients with TP53 mutations (N = 27) and TP53‐wild‐type patients (N = 19). HER2 amplification‐positive patients were assessed in phase Ib, phase Ic and phase II pyrotinib trials. There were no differences in PFS between the two groups (HR 1.00, 95% CI 0.49–2.04, p = 1.00). (B) Comparison of PFS between patients with TP53 mutations (N = 33) and TP53‐wild‐type patients (N = 19) in the MSK‐BREAST cohort as validation, with the same result (HR 1.19, 95% CI 0.60–2.37, p = 0.62). (C) Comparison of PFS between patients with (N = 20) and without (N = 26) TP53 DBD mutations in phase Ib, phase Ic, and phase II pyrotinib trials. No difference in PFS was shown between the two groups (HR 1.51, 95% CI 0.74–3.05, p = 0.25). (D) Comparison of PFS between patients with (N = 14) and without (N = 32) TP53 missense mutations in phase Ib, phase Ic, and phase II pyrotinib trials. No difference in PFS was shown between the two groups (HR 1.66, 95% CI 0.80–3.48, p = 0.18). HR, hazard ratio. PFS, progression‐free survival. HER2, human epidermal growth factor receptor 2. DBD, DNA‐binding domain; Mut, mutation; Wt, wild type
