FIGURE 3.

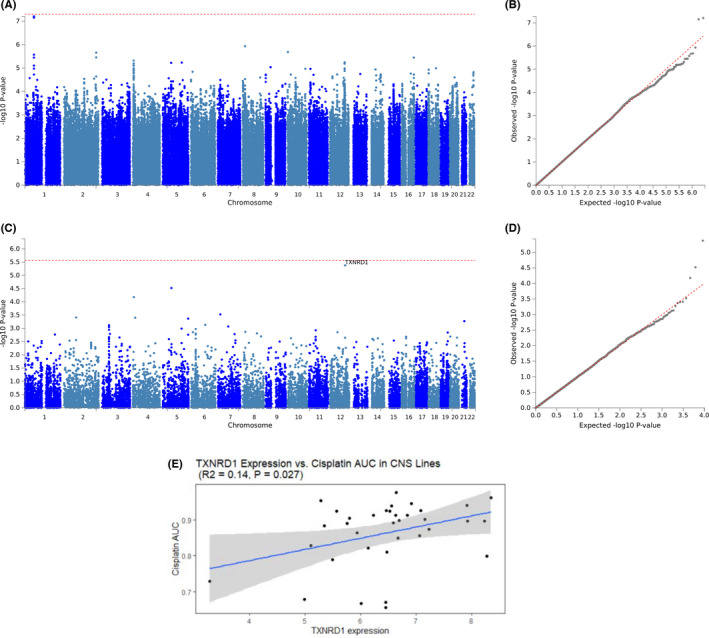
Genome‐wide single nucleotide polymorphism (SNP) and gene‐based association studies of cisplatin‐induced hearing loss. (A) Manhattan plot of genome‐wide association study (GWAS) results for cisplatin‐induced hearing loss. (B) Quantile–Quantile plot of GWAS results for cisplatin‐induced hearing loss. Covariates in the GWAS include cumulative cisplatin dose, age at clinical evaluation, and 10 European genetic principal components accounting for population substructure. (C) Manhattan plot of the gene‐based association analysis identifies TXNRD1 (p = 4.2 × 10⁻⁶) as nearly genome‐wide significant. Summary statistics for SNP‐based GWAS were uploaded to functional mapping and annotation to run a gene‐based association analysis based on a multiple linear principal components regression to determine the aggregated effect of all SNPs within a gene. Inputted SNPs were mapped to 18,544 protein coding genes, producing a significance threshold of p = 0.05/18,544 (2.7 × 10⁻⁶). (D) Quantile–Quantile plot of results from the gene‐based association analysis. (E) Scatter plots of cisplatin sensitivity as a function of normalized TXNRD1 expression in central nervous system (CNS) tumor cell lines (ρ = 0.4, p = 0.04; R 2 = 0.1, p = 0.03). Cisplatin sensitivity, measured as the area under the cisplatin dose–response curve, for all CNS tumor cell lines extracted from CancerRX. Gene expression data were downloaded from the Cancer Cell Line Encyclopedia. Expression data were rank normalized to fit a normal distribution prior to analysis. Correlation was assessed nonparametrically using the Spearman rank method, as well as by linear regression
