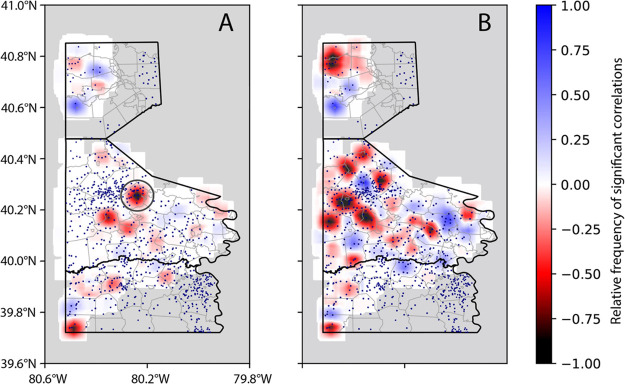
Figure 3.
Sliding window heat maps showing the relative frequency of statistically significant correlations between (A) methane concentrations ([CH4]) or (B) chloride concentrations ([Cl]) and the distance to the nearest unconventional oil and gas well. Red indicates an area with a negative relationship ([CH4] or [Cl] increases as the distance to a UOG well decreases) and blue areas signify a positive relationship ([CH4] or [Cl] decreases as the distance to a UOG well decreases). Color intensity corresponds to the relative frequency of significant correlations in the area. UOG well locations are denoted with blue dots on the map. Within the hotspot circled in 3A, multiple lines of evidence are consistent with CH4 leaking from a UOG well/wells to groundwater.

