FIGURE 12.

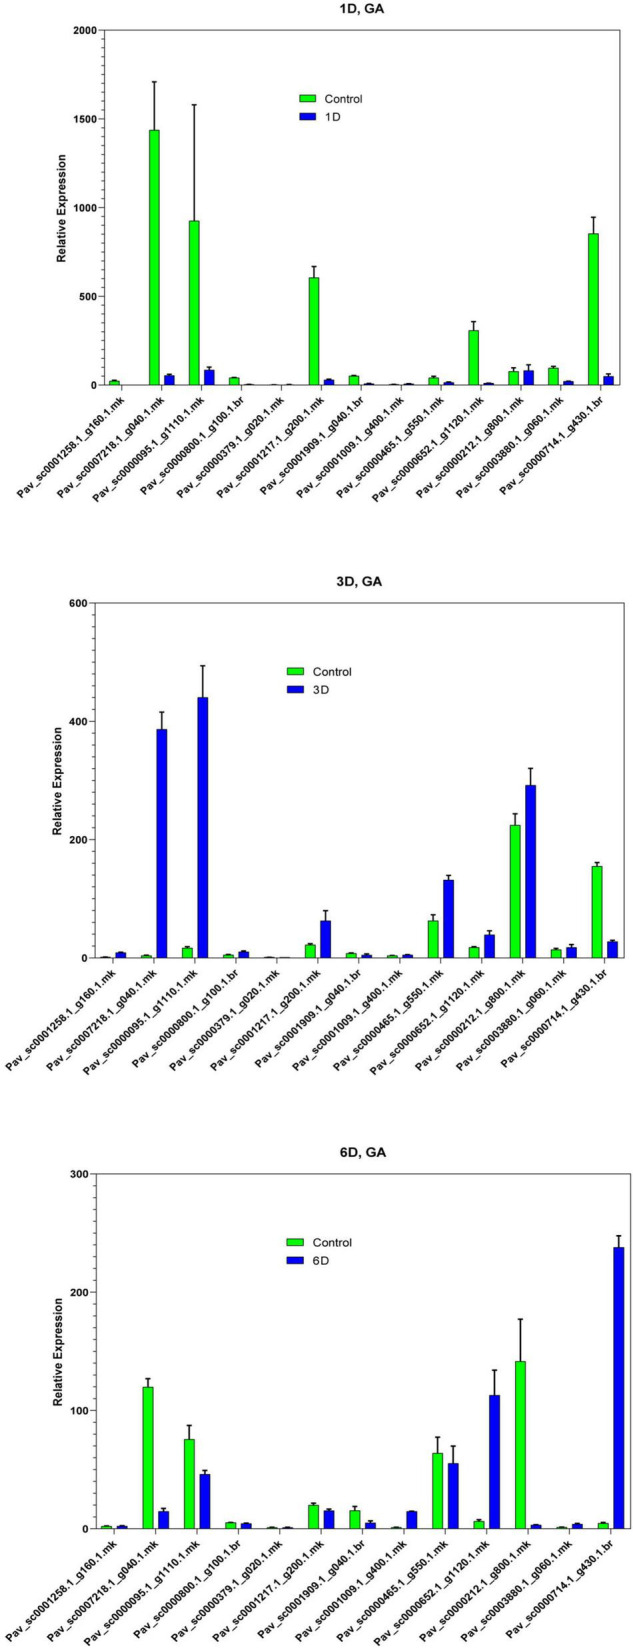
Expression profiles of selected PavGaox genes on the bud before (control) or 1D, 3D, and 6D after treatment with GA. Mean ± SE of three biological replicates (each having three technical replicates).

Expression profiles of selected PavGaox genes on the bud before (control) or 1D, 3D, and 6D after treatment with GA. Mean ± SE of three biological replicates (each having three technical replicates).