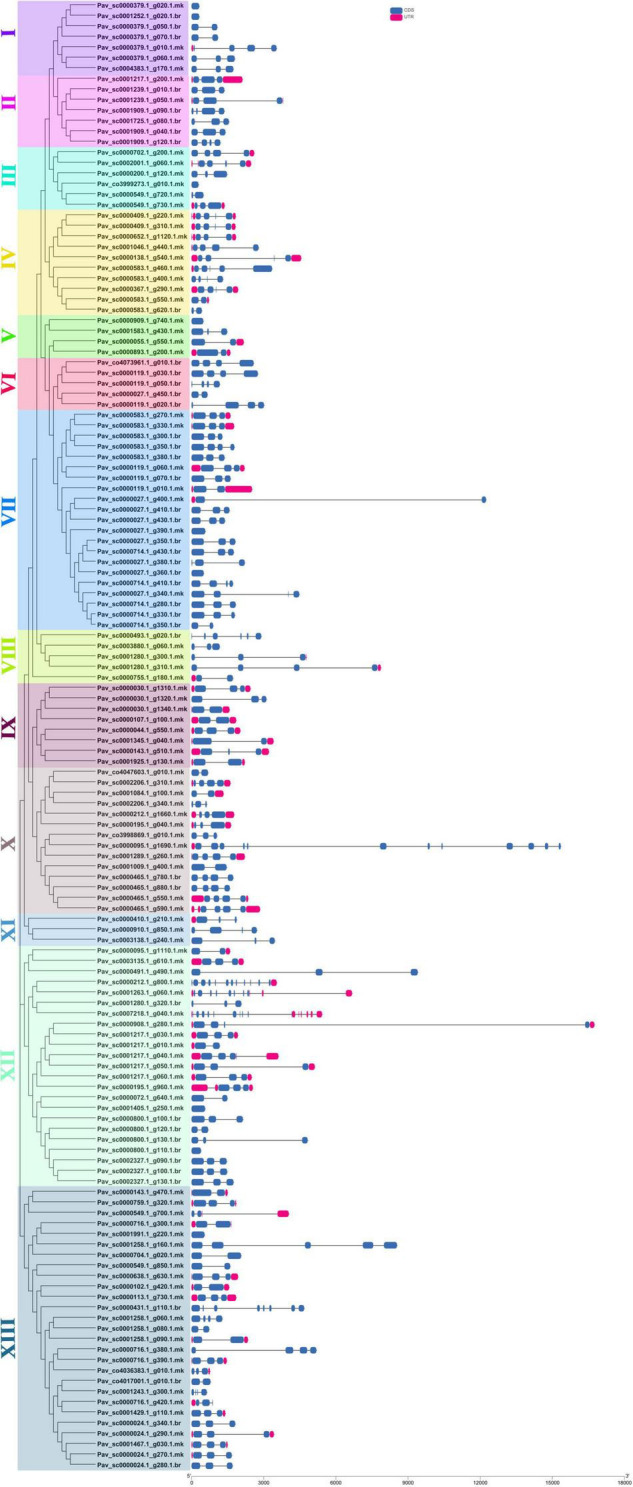
FIGURE 3.

Phylogenic relationships and gene structure for GAox family proteins in sweet cherry. The relative position and size of the exon can be estimated using the scale at the bottom. Blue boxes, black lines, and red boxes represent exons, introns, and UTR, respectively.
