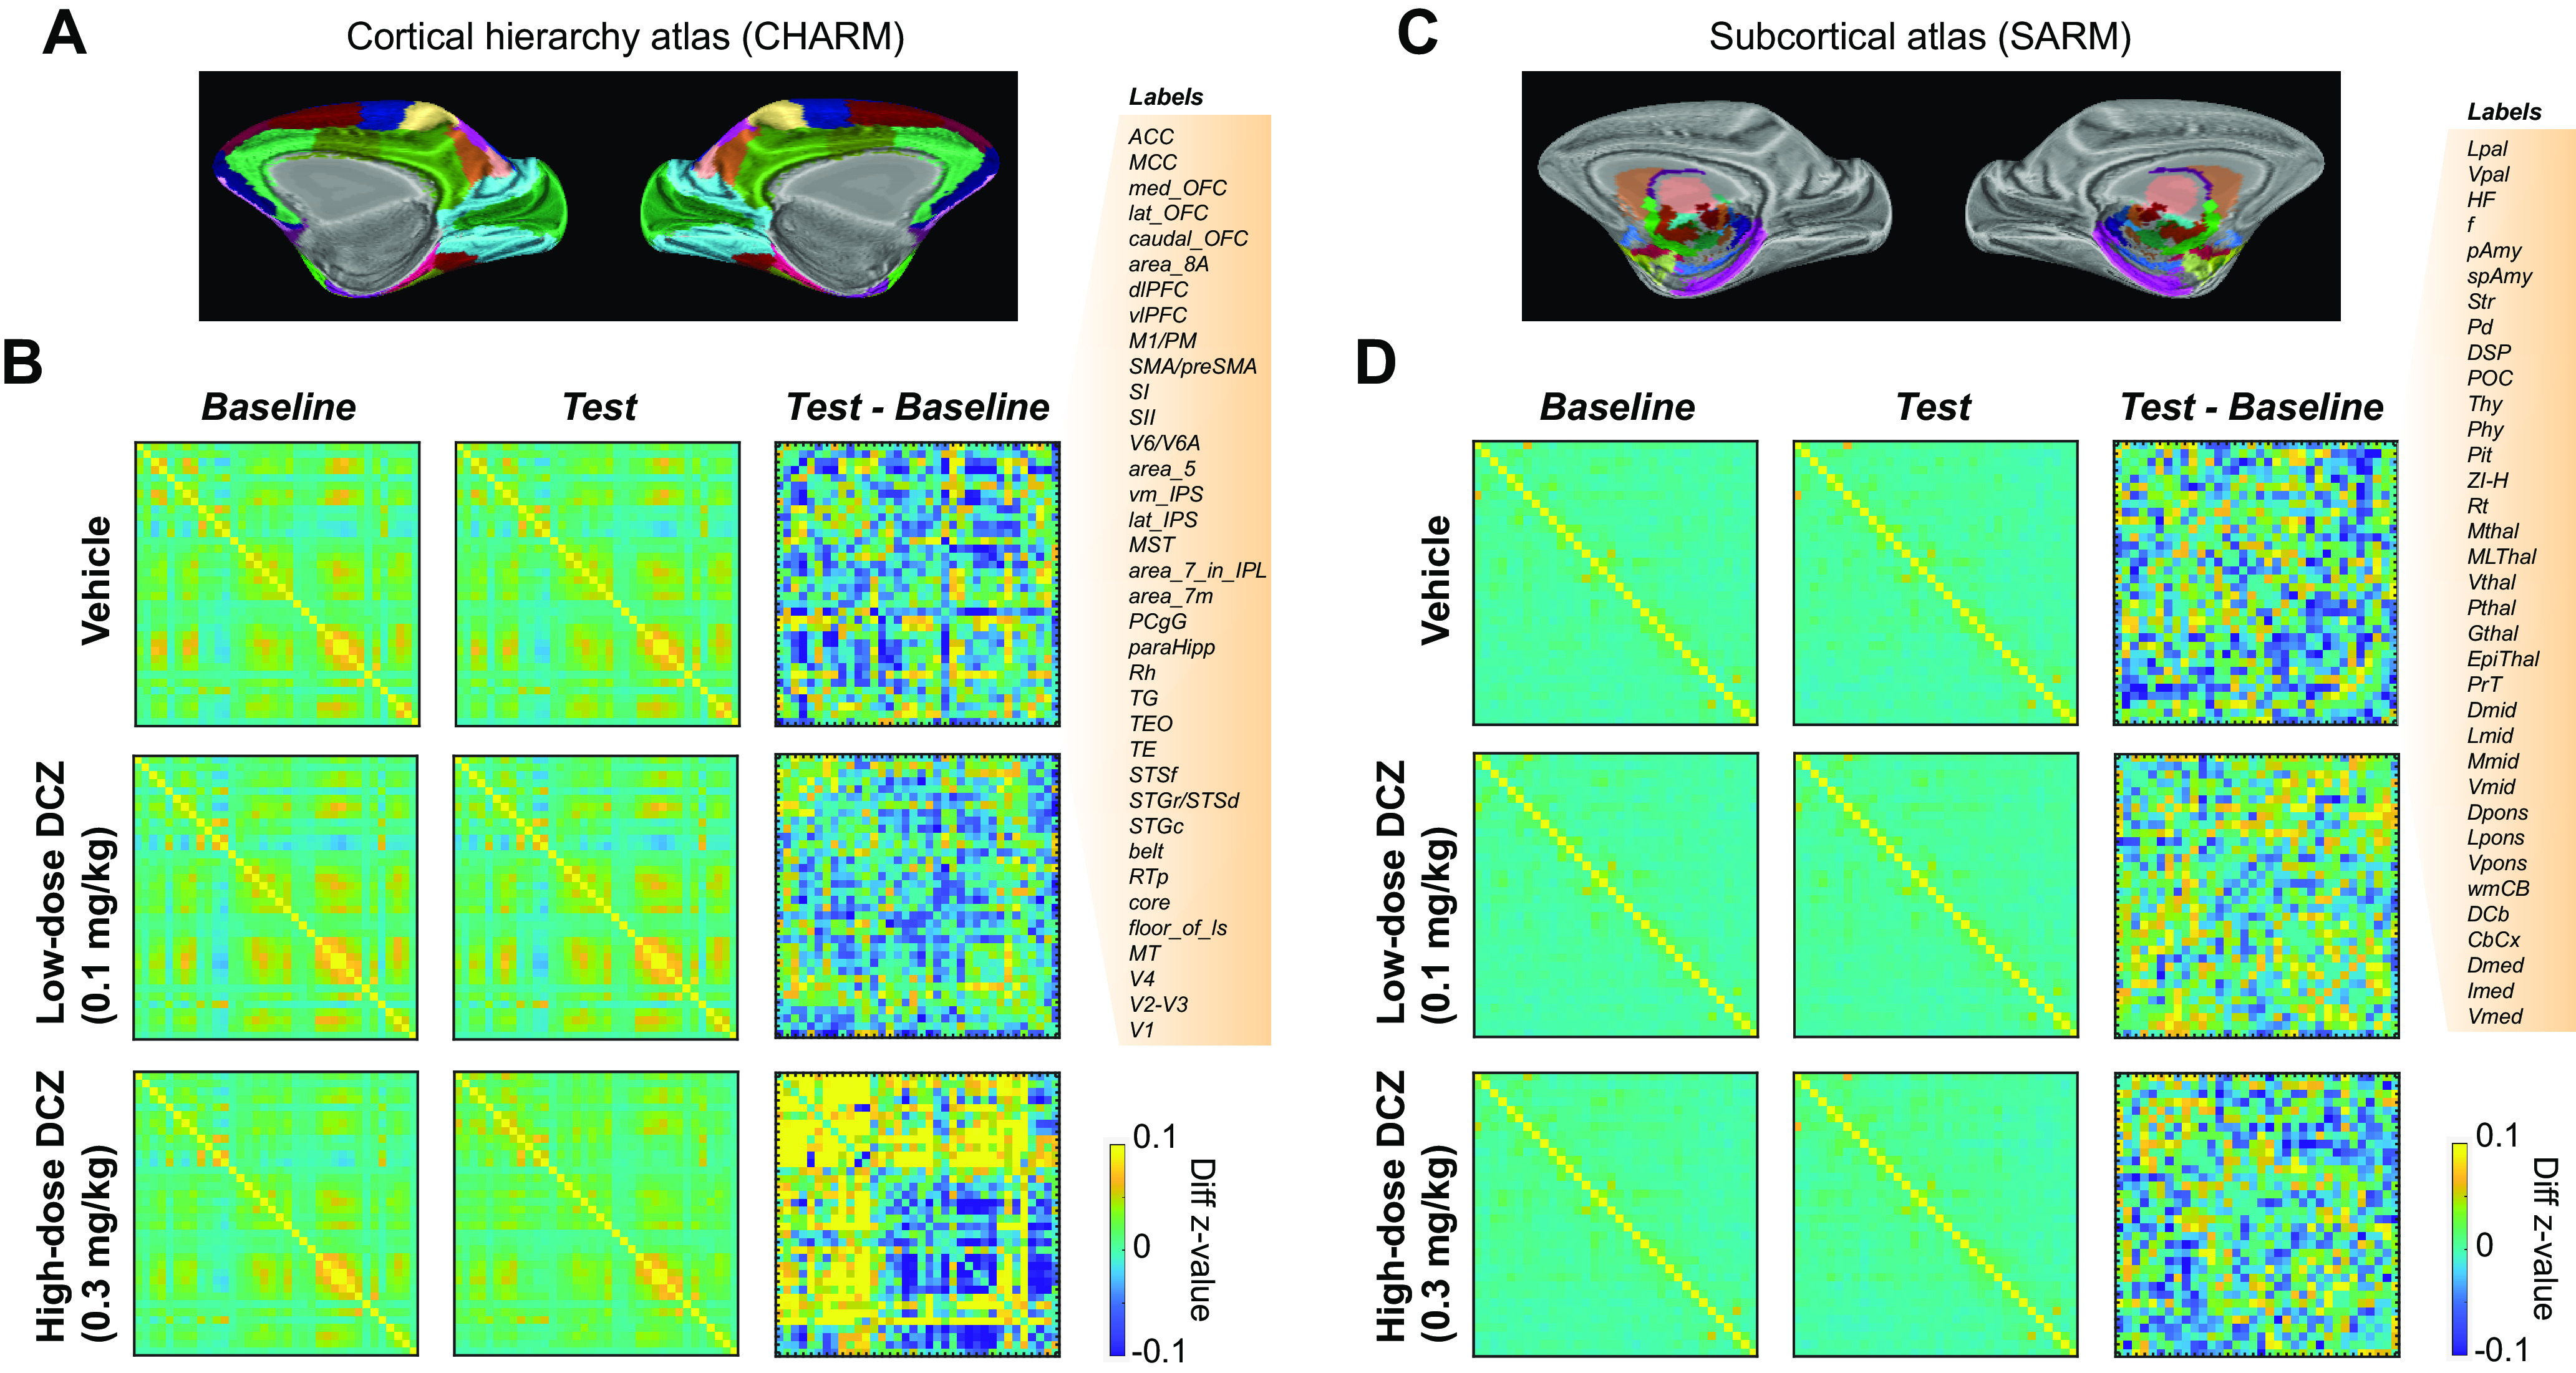
Figure 2.

fMRI-based connectome changes after DCZ administration in an example subject. A, CHARM atlas Level 3 visualized on an inflated brain (medial view). B, Brainwide functional connectivity in cortical areas. Confusion matrices represent connectome in baseline scans (left column), test scans (middle column), and the difference between test and baseline (right column) for either in the vehicle (top), low-dose DCZ (middle), and high-dose DCZ condition (bottom), respectively. Color represents z-transformed correlation coefficients. Labels on the right side represent ROIs from CHARM atlas. C, SARM atlas Level 3 visualized on an inflated brain. D, Confusion matrices for subcortical areas with labels for SARM ROIs on the right side. Conventions are as in B.
