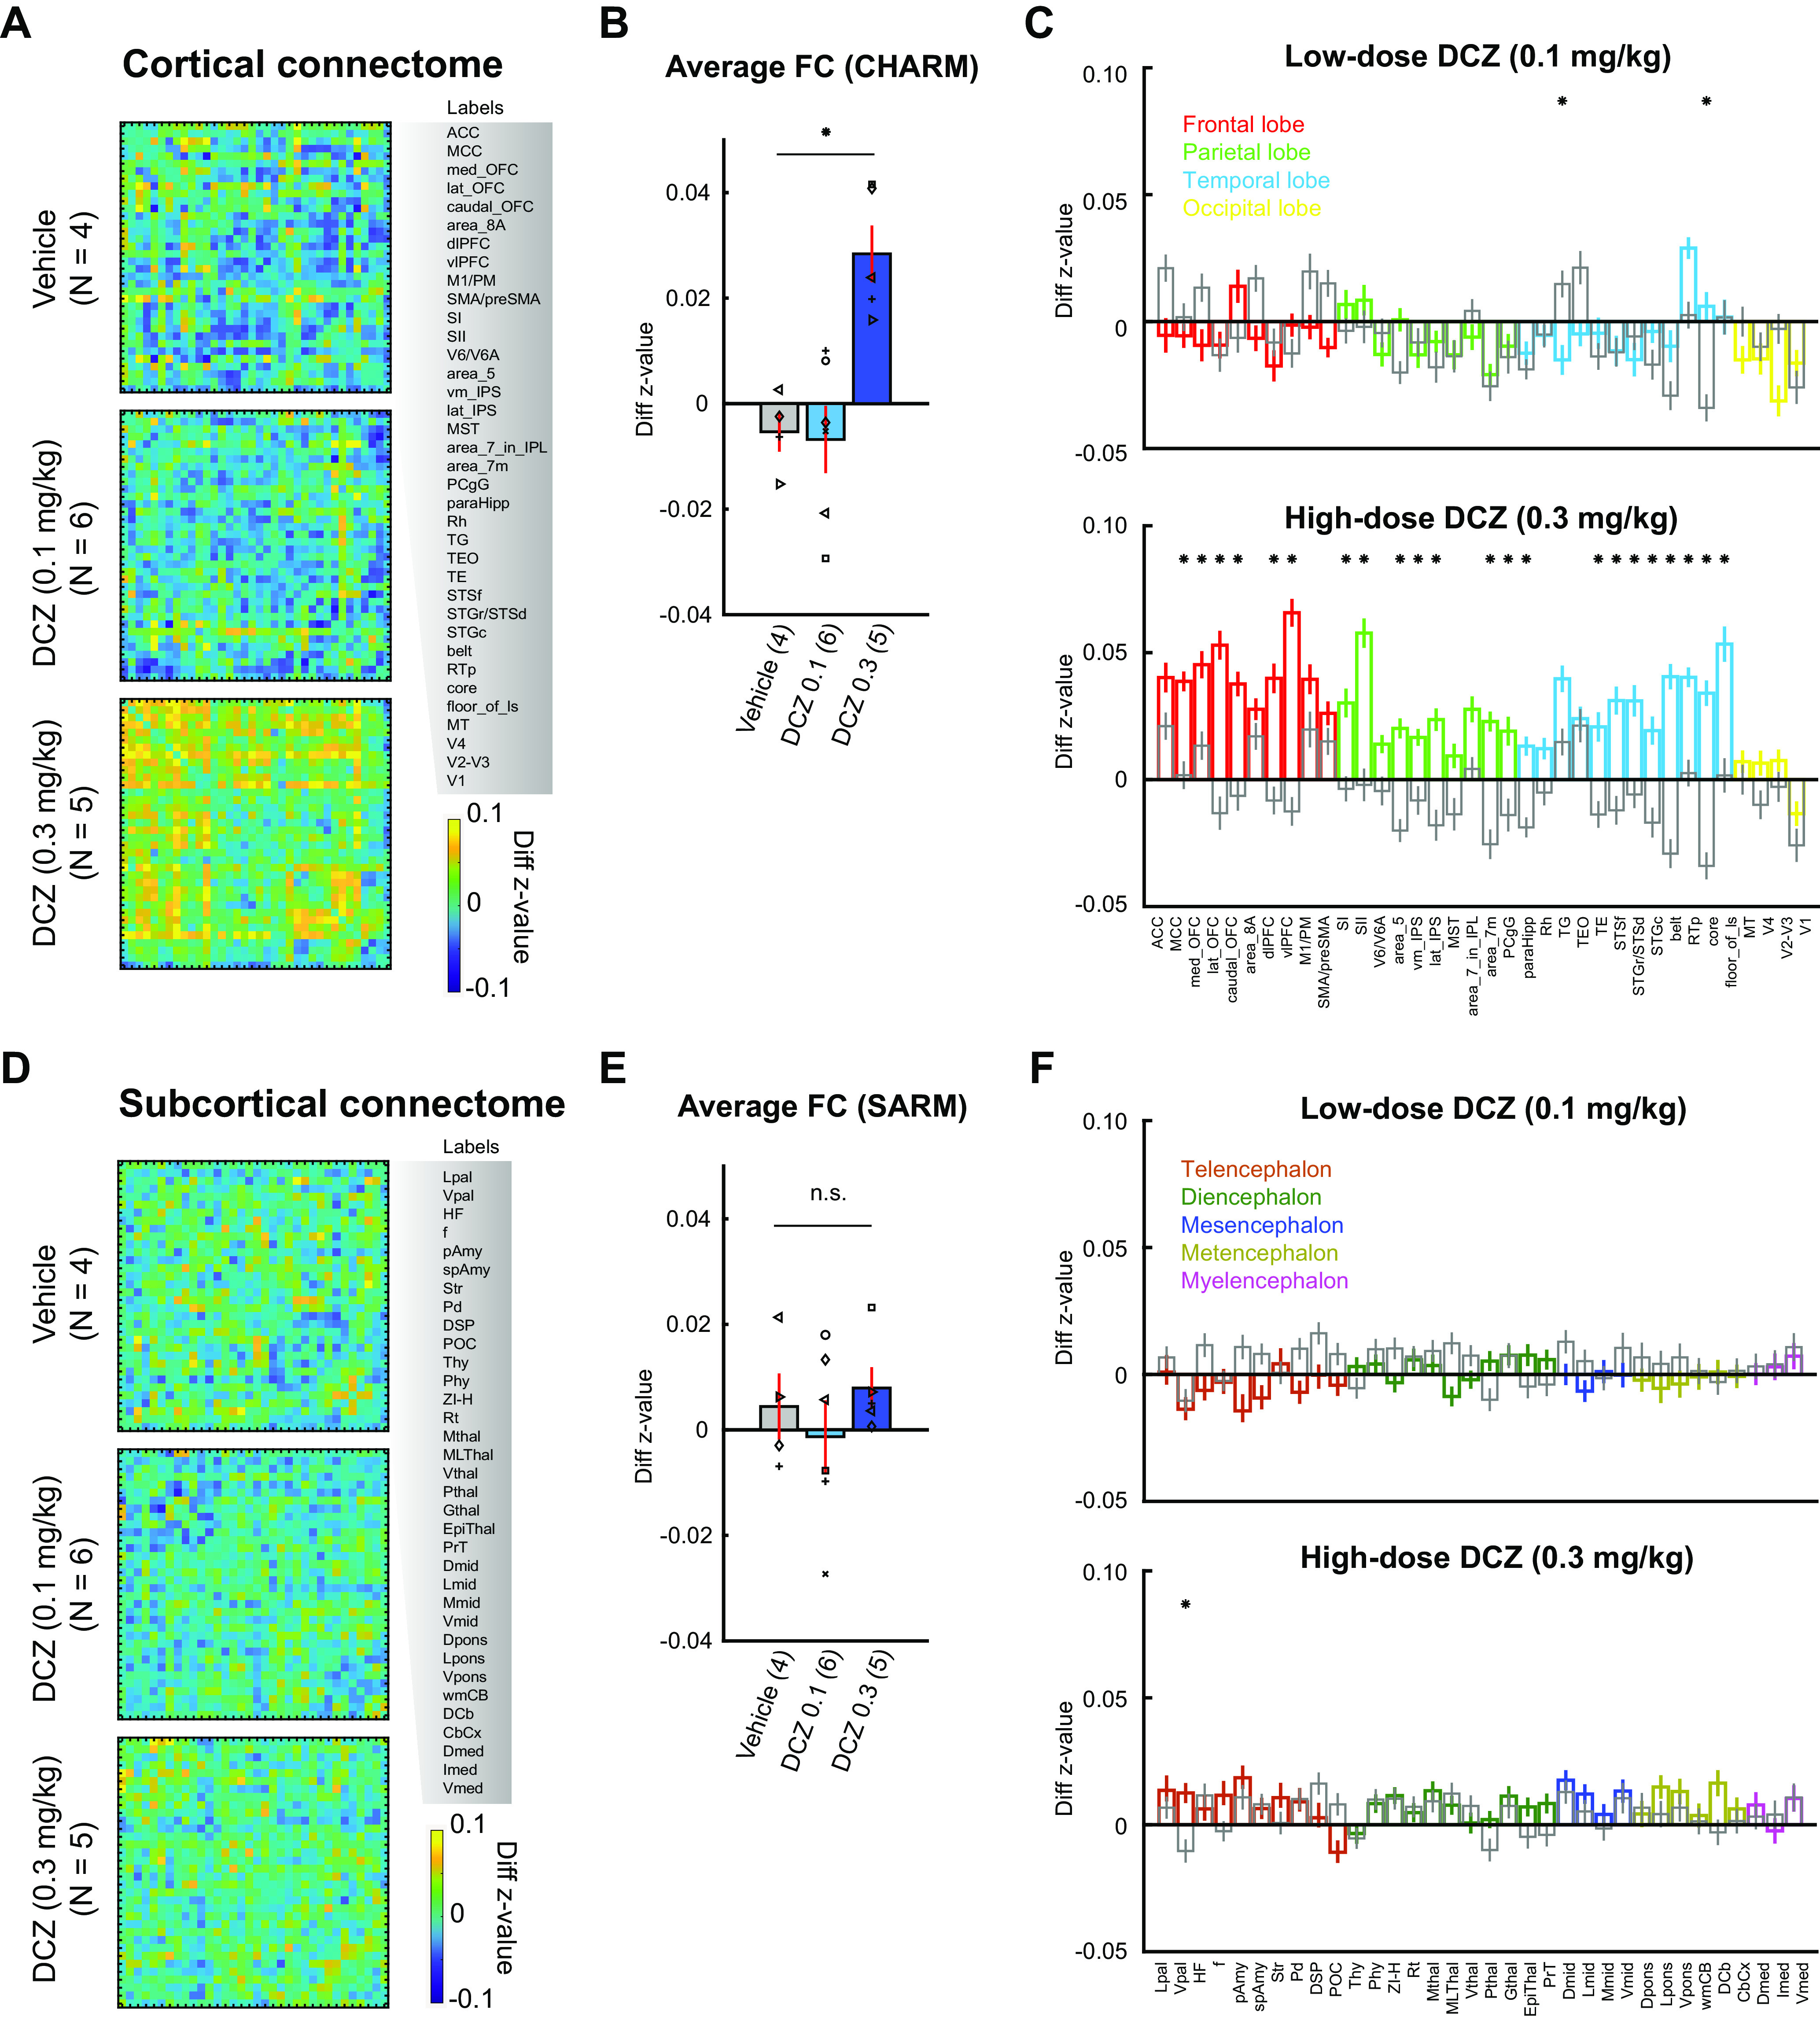
Figure 3.

Group-level changes in the fMRI-based connectome following DCZ administration. A–C, Functional connectivity changes in cortical areas. A, Confusion matrices represent differences in z value (test – baseline) for vehicle (top), low-dose DCZ (middle), and high-dose DCZ (bottom) conditions. Labels on the right side represent ROIs from CHARM atlas (Level 3). B, Averaged functional connectivity. Bars represent averaged z value differences for vehicle, low-dose DCZ, and high-dose DCZ conditions. Error bars indicate SE. Symbols represent subjects. *p = 0.016, Significant interaction of drug × area category (two-way ANOVA). Numbers on the labels indicate the number of subjects for each condition. C, Functional connectivity in each area. Bars represent averaged z value differences averaged for each area of the CHARM atlas. Colors represent frontal (red), parietal (green), temporal (cyan), and occipital areas (yellow) for low-dose (top) and high-dose (bottom) DCZ conditions. Gray bars represent vehicle condition. Error bars indicate SE. *p < 0.01, Significant difference between vehicle and DCZ conditions (Bonferroni correction, rank-sum test). D–F, Functional connectivity changes in subcortical areas. Conventions are the same as in A–C. F, Colors represent telencephalon (dark red), diencephalon (dark green), mesencephalon (dark blue), metencephalon (dark yellow), and myelencephalon areas (magenta).
