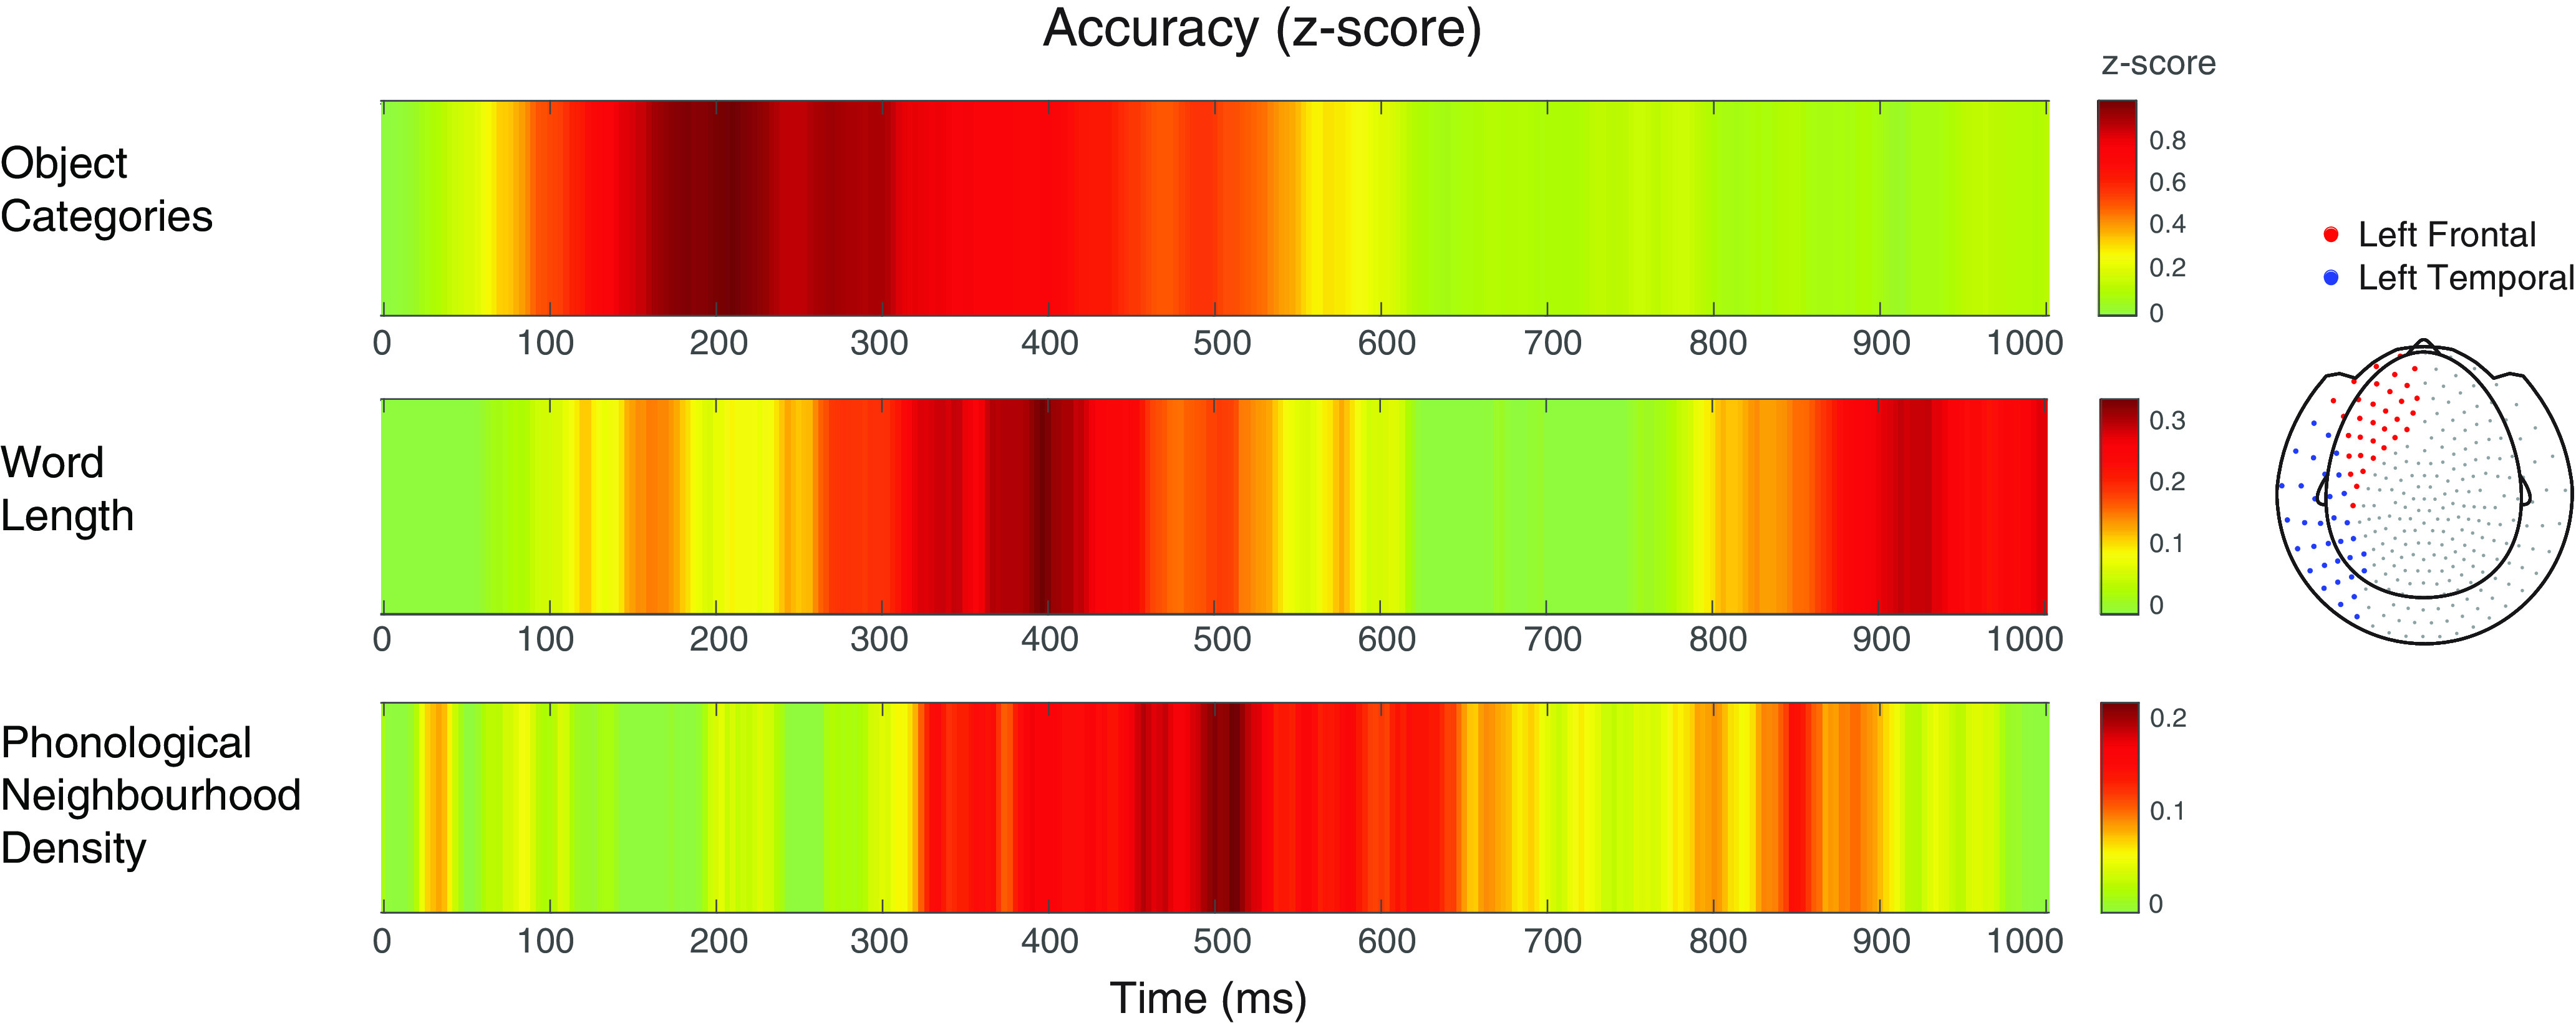
Figure 3.

Overview of the searchlight results visualised as time course of decoding accuracy across left frontal and temporal sensors (as displayed in the topographic view on the right of the figure) for the key study variables: object category (top), word length (middle), and phonological neighborhood density (bottom). For each contrast of interest, the color bar represents the Z-standardized decoding accuracy values, from zero values (in green), to increasingly positive Z scores (up to dark red).
