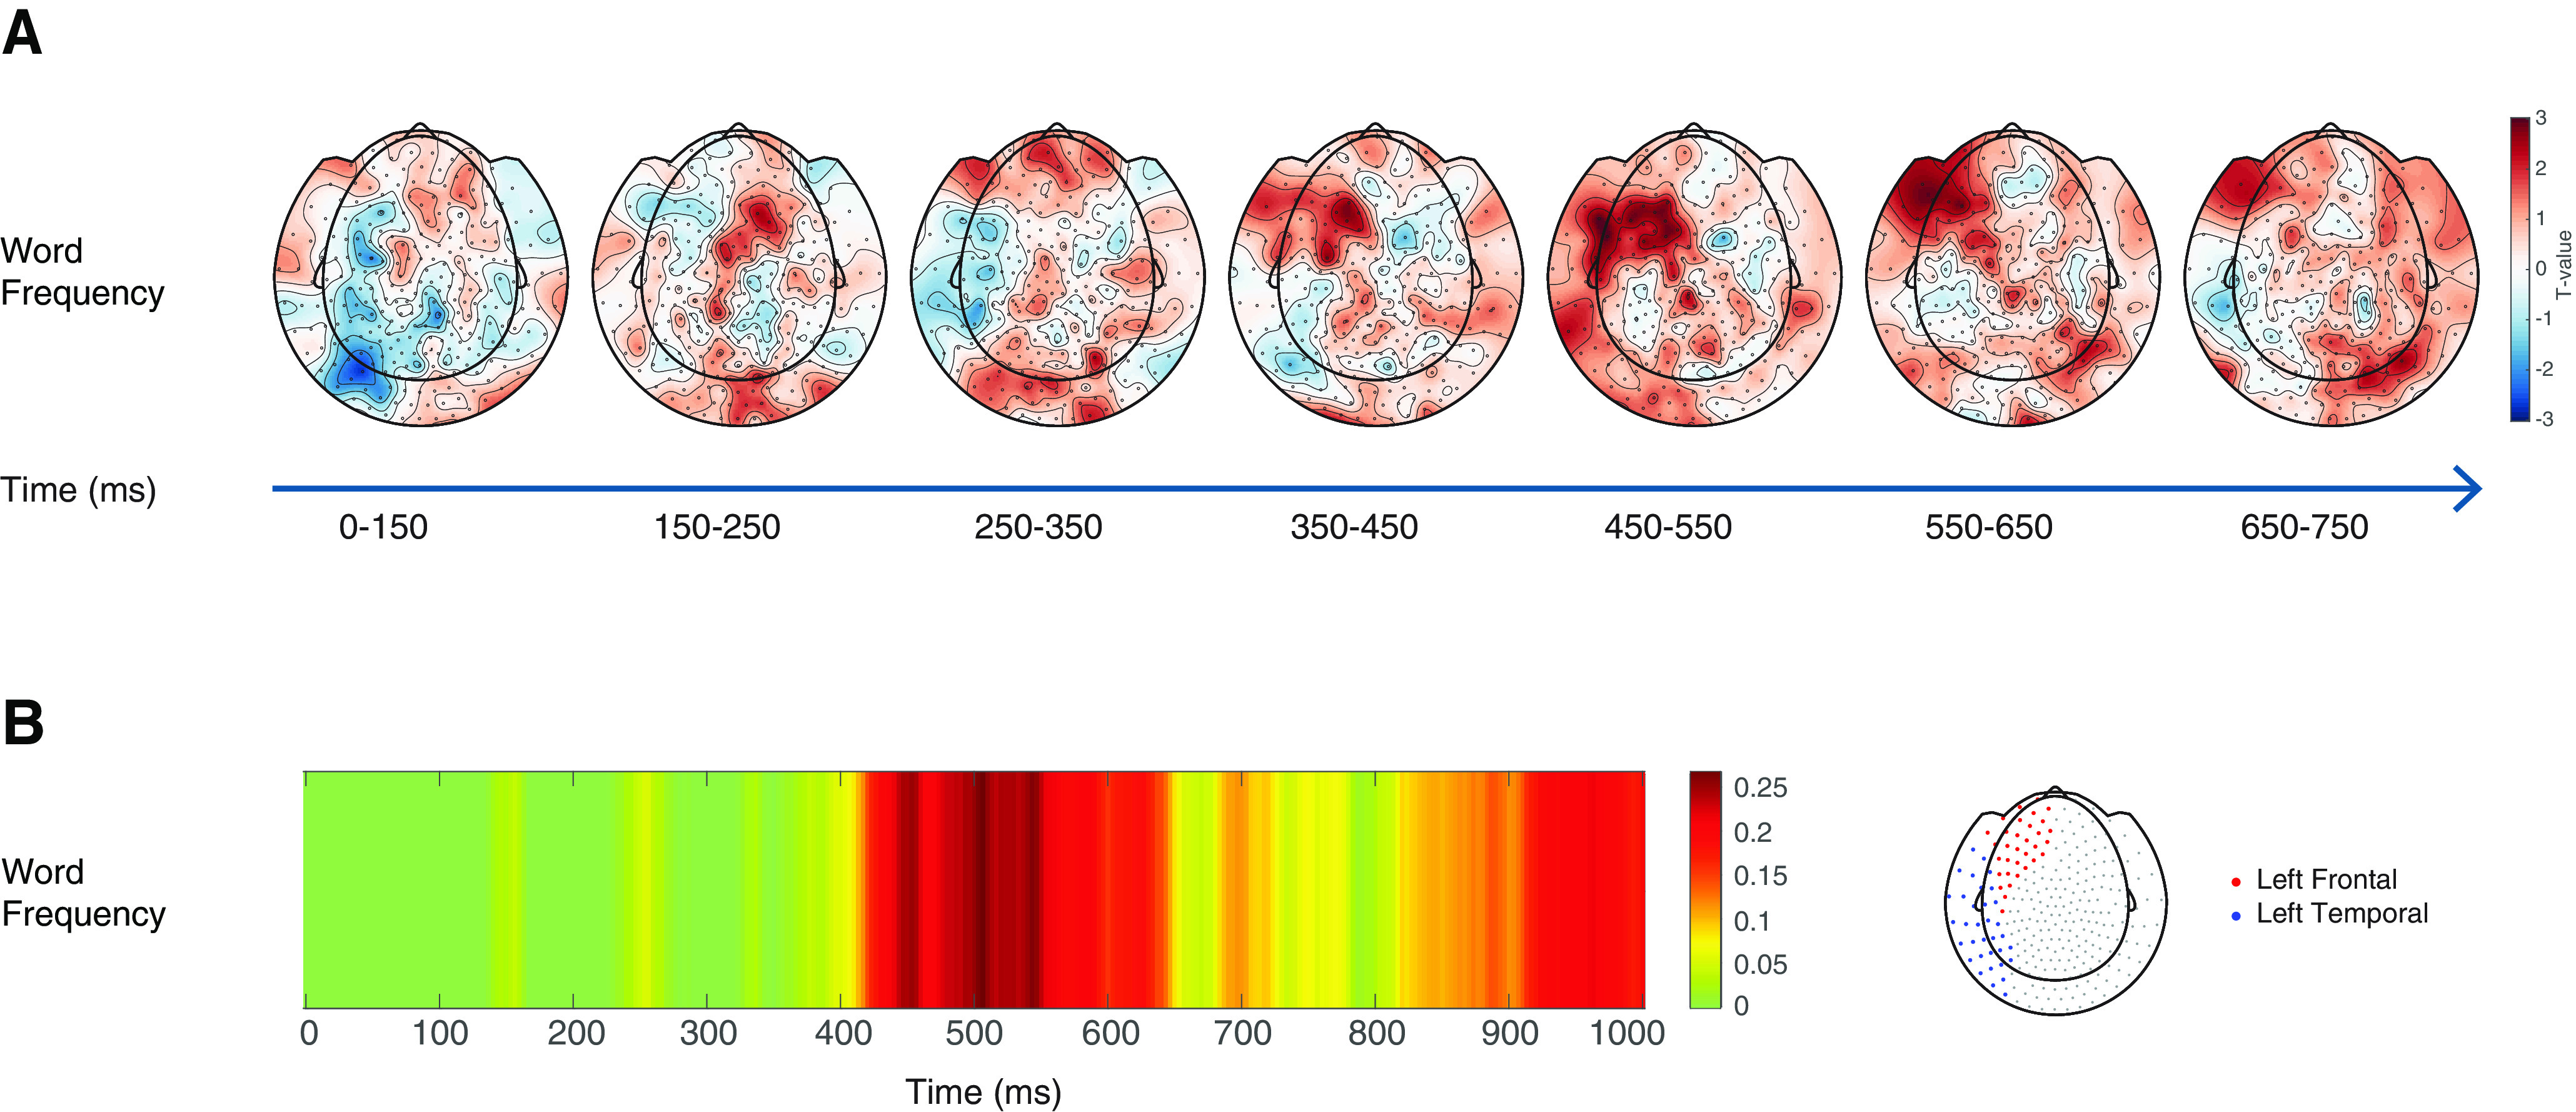
Figure 4.

A, Topographic maps displaying the effect of decoding accuracy (T statistic) for word frequency. For each contrast of interest, the color bar represents the Z-standardized decoding accuracy values from zero values (in green), to positive Z scores (up to dark red). Note the early activity arising from central sensors for the word frequency condition, in a time window that was comparable to the effects in central sensors found for word length. B, Overview of the searchlight results displayed as time course of decoding accuracy across left frontal and temporal sensors (as displayed in the topographic view on the right of the figure) for word frequency.
