Figure 2.
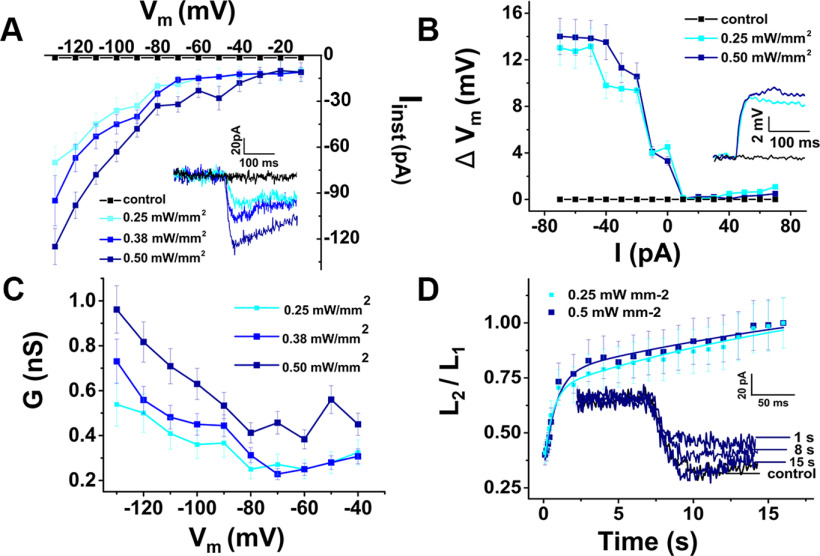
Light activation of ChR2 depolarizes ChR2 mouse DC membrane potentials ex vivo. A, Current-voltage (I–V) plot: peak current amplitudes (Iinst) of a DC in response to blue-light illumination at different power densities, as functions of the membrane potential (Vm). Average currents measured from a holding potential of −90 mV, at a step potential of −130 mV, for 0.25, 0.38, and 0.50 mW/mm2 light intensity, were −70 ± 10, −95 ± 16, and −125 ± 12 pA, respectively, n = 12. Inset, Inward current traces at different blue-light power densities (−90 mV holding potential). B, Light-induced potential-current (ΔVm-I) relationship of a DC: membrane-potential changes (ΔVm) during blue-light illumination as functions of injected currents (I). Light-induced depolarizations were elicited during negative current injection. Average potential changes measured from resting membrane potential, at a current step of −80 pA 0.25 and 0.50 mW/mm2 light intensity were 14.0 ± 1.6 and 13.0 ± 1.5 mV, respectively, n = 6. Inset, Whole-cell current-clamp recording (resting membrane potential of −50 mV) of light-elicited depolarization with different blue-light power densities. C, Conductance G as a function of membrane potential Vm at 3 different blue-light power densities using data in A at −90 mV holding potential. Increasing blue-light power increased the maximum measured DC membrane conductance at a step potential of −130 mV (0.54 ± 0.09, 0.73 ± 0.09, and 0.96 ± 0.11 nS, respectively, n = 12). D, ChR2 recovery kinetics after 1 s light stimulation in DCs at −90 mV holding potential using a standard recovery-time protocol. An initial 1 s light stimulation (L1) was followed by a second light stimulation (L2) after a time ranging from 0.1 to 17 s. The ratio of peak currents (I2/I1) elicited by L2 and L1 is plotted as a function of the interpulse interval to show the recovery from L1. Inset, Examples of traces recorded in response to L2 after specified recovery times using 0.5 mW mm−2 light intensity. The exponential fits to the data were Ts for 0.25 mW mm−2: 0.54 ± 0.2 s, 23.05 ± 4.21 s (n = 2); for 0.50 mW mm−2: 0.78 ± 0.23 s, 27.43 ± 4.84 (n = 2 cells).

