Figure 6.
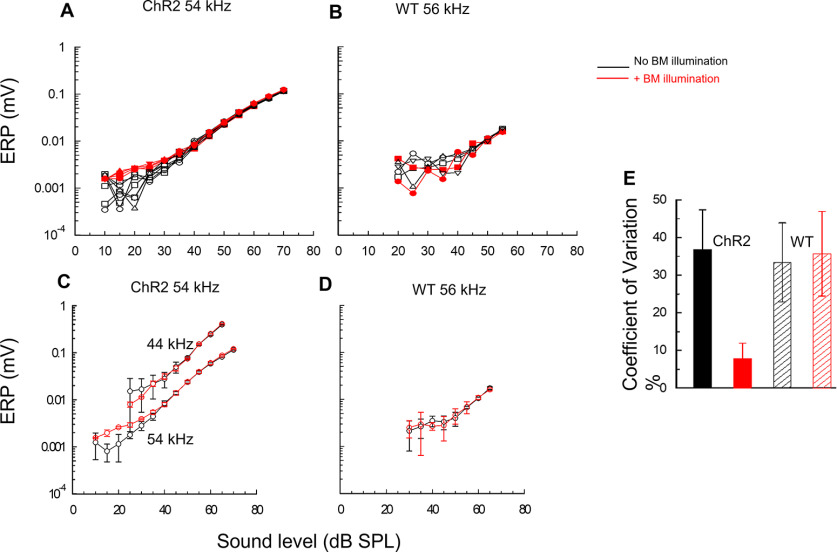
Light activation of ChR2-expressing DCs and OPCs suppresses continuous adjustments to actively amplified OHC electrical responses. A, B, superimposed succession of alternating measurements of ERP magnitude to tonal stimulation at 54 kHz from the 54 kHz BM location of a ChR2 mouse as a function of SPL, spaced at 5 min intervals, without and with OoC illumination (A), and for tonal stimulation at 56 kHz from the 56 kHz BM location of a WT littermate (B). C, D, Mean ± SD of data shown in A, B, with the addition of (A) mean ± SD for responses to 44 kHz at the 54 kHz location. E, CV. ChR2: without OoC illumination (black solid); with OoC illumination (red solid). WT: without OoC illumination (black hatched); with OoC illumination (red hatched). All measurements were uncompensated for and electrode characteristics. C, D, n = 6 without OoC illumination and n = 5 with OoC illumination. OoC illumination: 200 µm beam diameter, wavelength: 473 nm, power density = 0.25 mW mm−2.

