Figure 2.
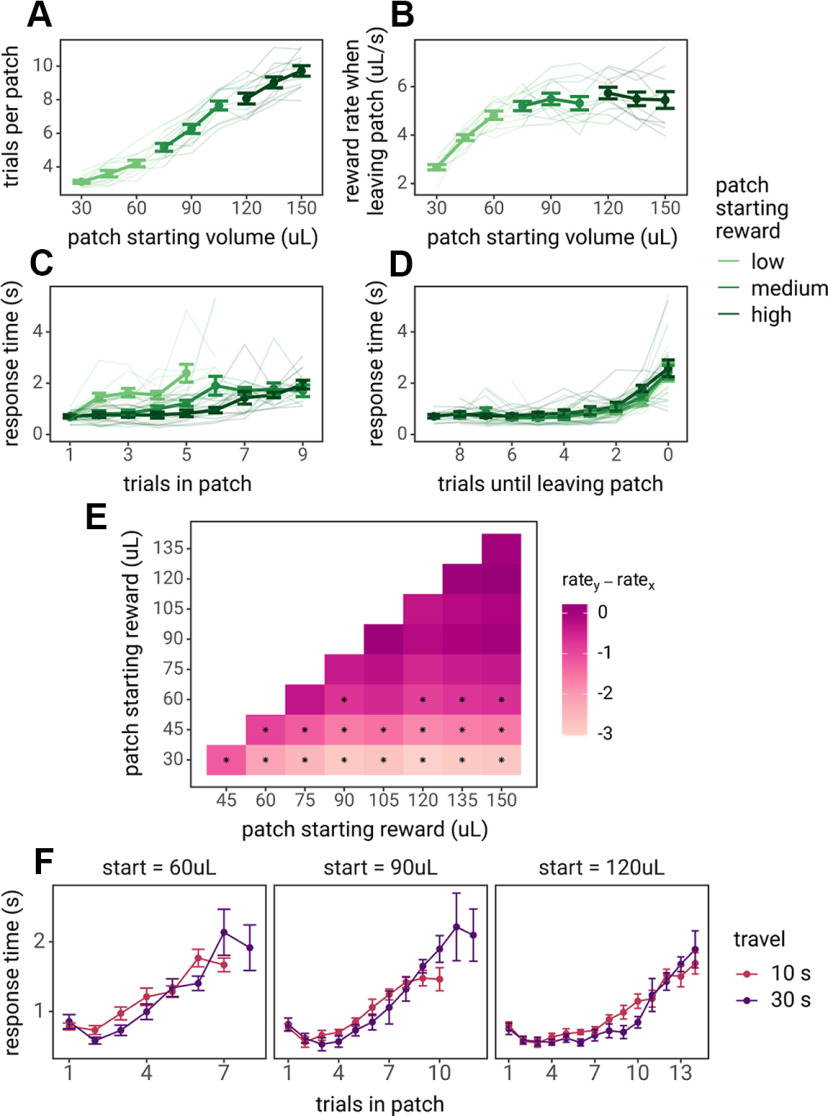
Rat behavior in the patch foraging task. In all panels, points, dark lines, and error bars represent the mean and SE across rats, and lighter lines represent behavior of each individual rat. A, The number of trials spent in each patch as a function of the starting reward volume of the patch. B, The reward rate (reward volume/trial time) rats received on the trial before rats chose to nose poke to leave the patch. C, The median RTs for each rat over the course of trials in the patch, split by patches that started with low (30–60 μl), medium (75–105 μl), or high (120–150 μl) starting reward volumes. D, The median RTs for each rat as rats became closer to leaving patches; 0 trials remaining in the patch indicated the trial in which they nose poked to leave the patch, 1 trial remaining is the last lever press to stay in the patch, 2 is the second to last lever press before leaving the patch, etc. E, Pairwise t tests across the patch leaving threshold (the local reward rate when rats decided to leave the patch), for all patch types. Colors indicate the difference in the reward rate threshold at which rats decided to leave the patches (i.e., y-axis leaving threshold – x-axis leaving threshold). Asterisks indicate statistically significant comparisons (pairwise χ2 tests with Holm–Bonferroni correction). F, Median RTs of rats from the travel time experiment by Kane et al. (2019). Rats visited patches that started with 60, 90, or 120 μl within sessions and experienced travel time delays of 10 or 30 s in separate sessions.

