Figure 3.
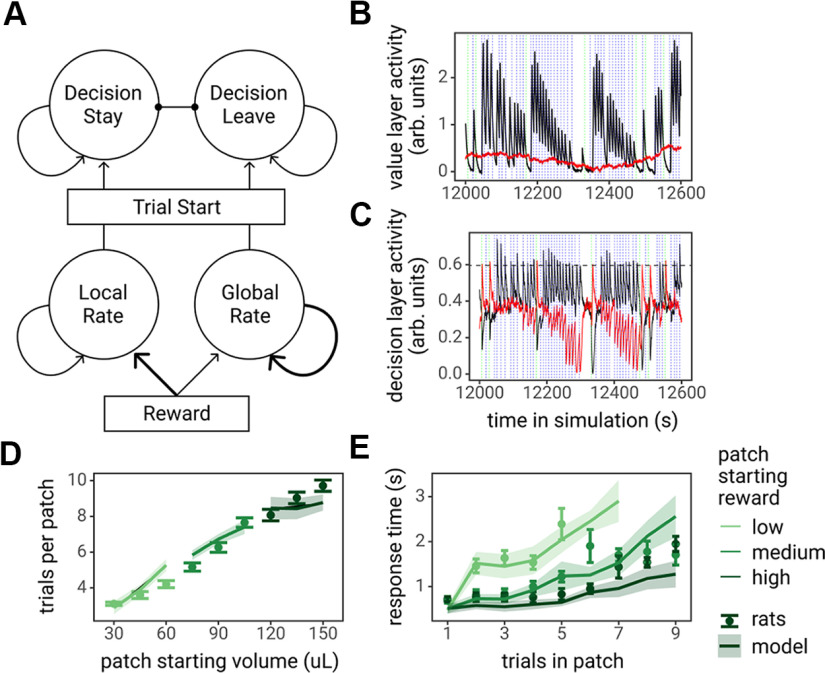
The leaky accumulator model of the foraging task. A, Diagram of the model, consisting of two layers of leaky accumulators. The bottom layer, the value layer (“local rate” and “global rate” units), estimated the local reward rate and global reward rate by integrating over rewards on different timescales. The top layer, the decision layer, was an LCA model that made decisions to stay versus leave via an accumulation to bound process at the start of the trial, with input from the local and global rate units. B, C, Example activity of the value layer and decision layer units during a 600-s sample of a model simulation. The solid black lines represent the local reward rate and decision stay unit activity, and the solid red lines represent the global reward rate and decision leave unit activity. The dotted blue and green vertical lines indicate the start of a trial in which the model decided to stay in the patch or to leave the patch, respectively. The horizontal dashed line in C represents the decision threshold. D, E, The leaky accumulator model-predicted number of trials spent in each patch type (D) and predicted RTs as by the number of trials spent in patches (E) plotted against observed rat behavior. Points and error bars represent the mean ± SE across rats, lines and ribbon represents the mean ± SE of model-predicted behavior for each rat.

