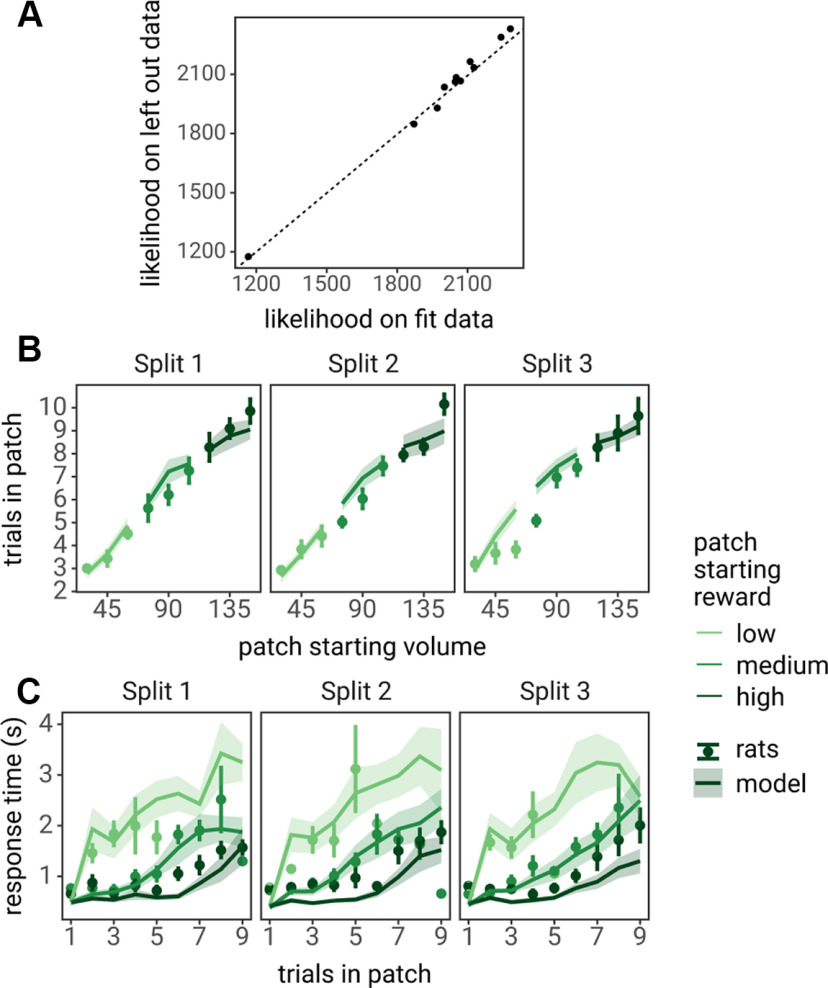
Figure 4.
Cross-validation analysis of the LCA model. A, The likelihood of the LCA model fit to all data (x-axis) compared with the likelihood of the model on left-out samples (parameters fit to two thirds of the data, likelihood calculated on the left-out third; y-axis). Each point represents individual rats; the dashed line represents the identity line (y = x). B, C, LCA predicted behavior (lines and ribbon) plotted against the left-out splits (points and error bars). Number of trials spent in patches is shown in B and RTs as a function of the number of trials spent in patches is shown in C. Points and lines indicate the mean across rats, error bars and ribbon indicate the SEM across rats.

