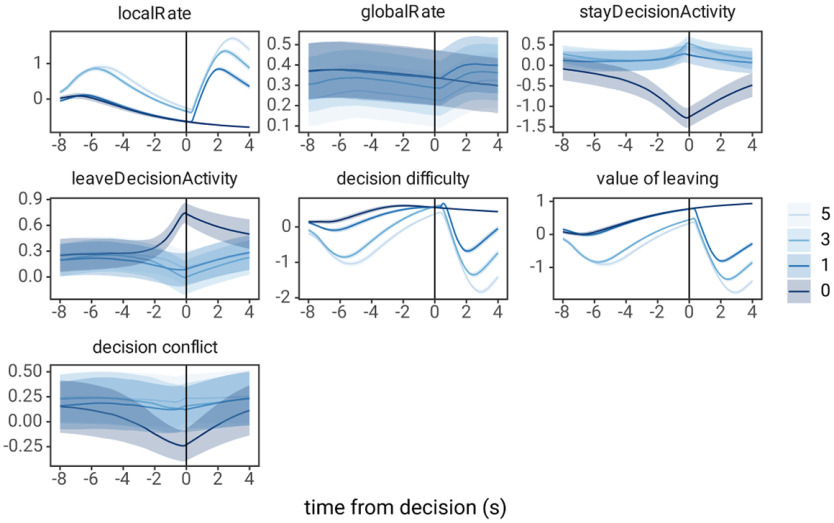
Figure 5.
PETHs of LCA model unit activity in the foraging task. Each panel represents the PETH of activity of LCA model units (localRate, globalRate, stayDecisionActivity, leaveDecisionActivity) or hypotheses for ACC activity measured from LCA model units (decision difficulty, value of leaving, and decision conflict) during a simulation of the foraging task. For each PETH, time = 0 represents the time of the lever press to harvest reward or nose poke to leave the patch, and colors represent the number of trials until leaving the patch.

