Figure 6.

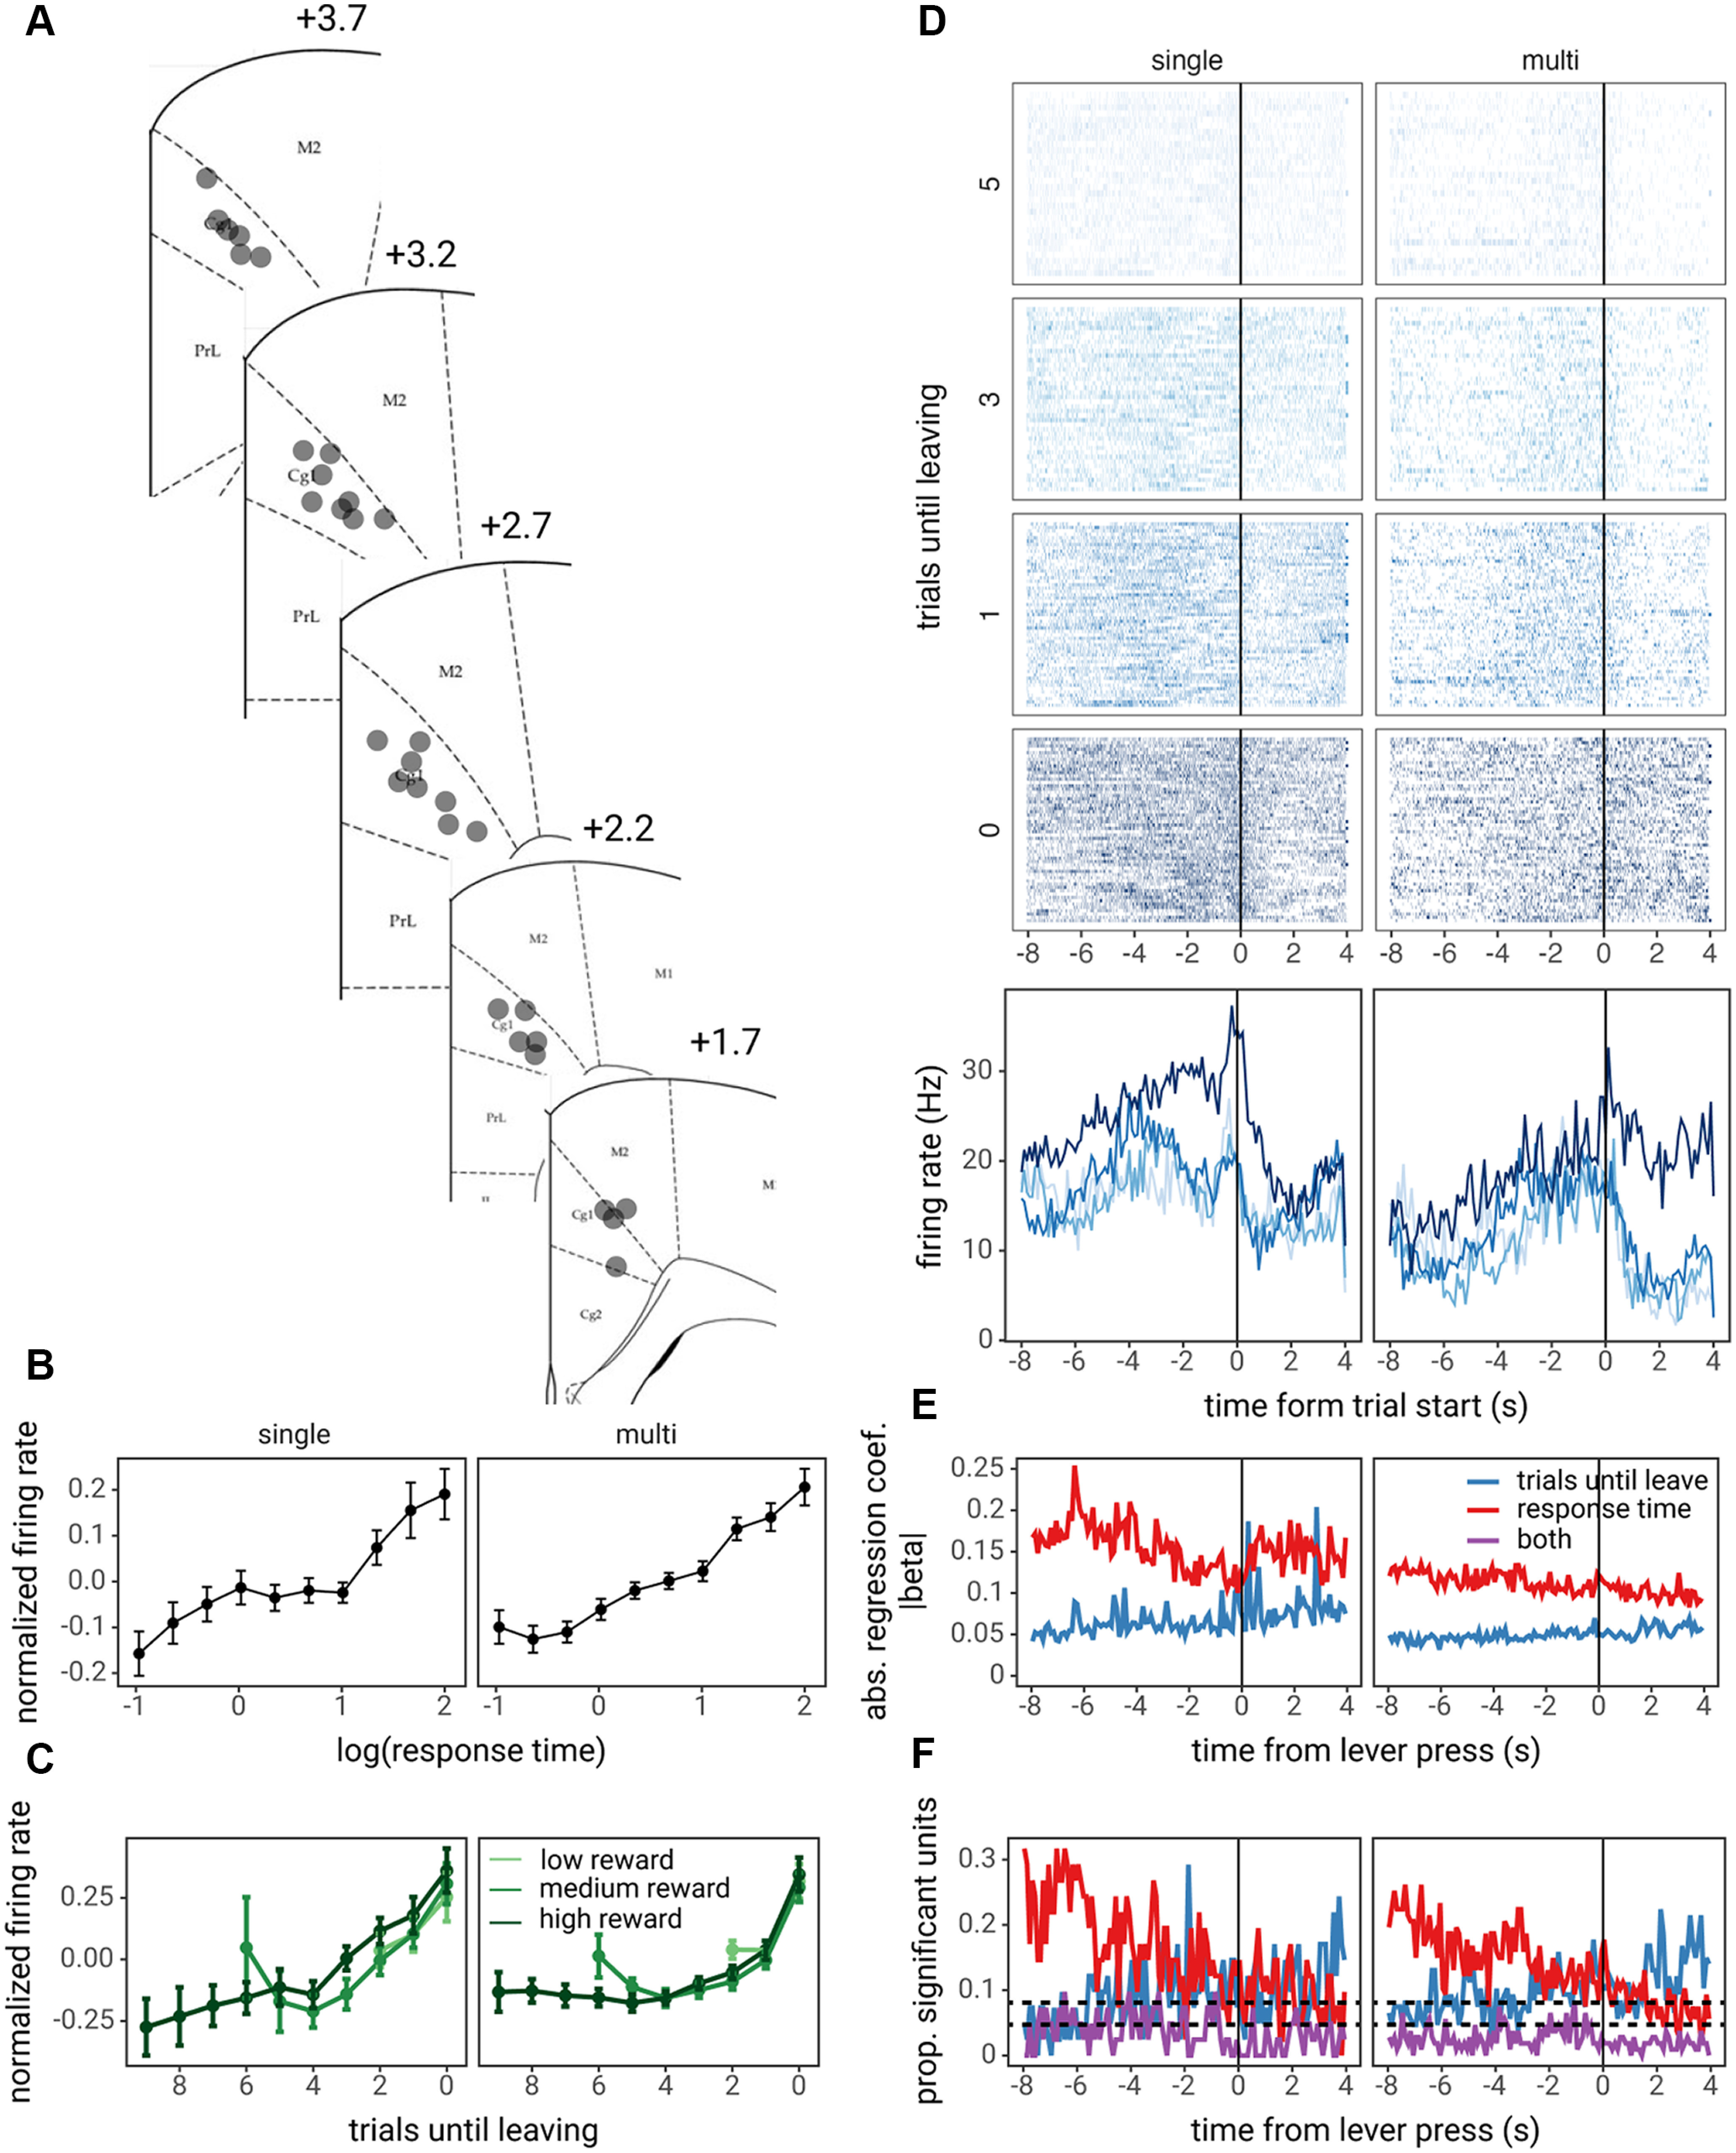
ACC activity correlates with foraging decisions and RTs. A, Diagram of recording locations within the Cg1 region; labels indicate distance from bregma. Example unit traces and isolation are shown in Extended Data Figure 6-1. B, C, Average ACC activity over the course of entire trials, normalized and averaged across units, as a function of the log of RTs (B) and trials until leaving the patch and the patch starting reward (C). Points and lines represent the mean normalized (z-scored) activity across units and error bars represent the SE across units. D, Trial-by-trial raster plot (top) and trial-averaged PETH (bottom) locked to the time of decisions for one example single unit and one example multi-unit. E, The average absolute effect of trials until leaving and RTs at each time point within a trial, locked to the time of the lever press to stay in the patch. F, The proportion of units with significant effects of trials until leaving, RTs or both (p < 0.05, z-test on regression coefficient), at each time point within the trial. The horizontal dashed lines represent the median and 95% confidence interval of the expected proportion of false positives given α = 0.05.
