Figure 7.
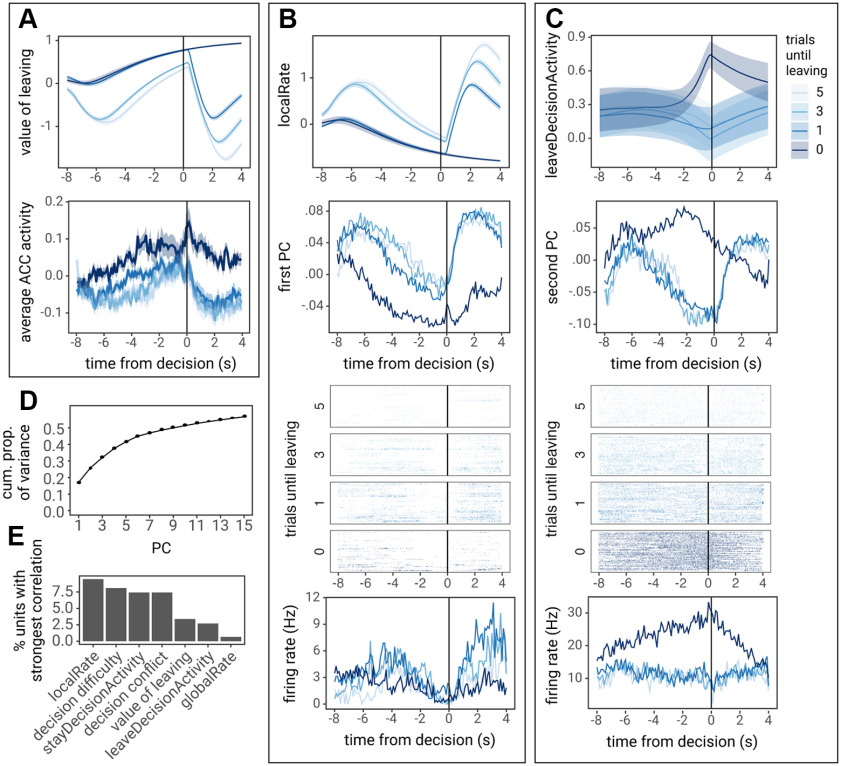
ACC activity correlates with leaky accumulator model decision variables. A, The value of leaving (globalRate – localRate; top) plotted next to average, normalized PETH across ACC units for 5, 3, 1, or 0 trials until leaving the patch (bottom). B, C, PCA was performed across the PETH for all units on these trials. The first nine PCs are presented in Extended Data Figure 7-1. B, The localRate unit activity from the model (top), next to the first PC of ACC activity (second panel), and an example unit that with a strong loading for the first PC (trial-by-trial raster in the third panel and trial-averaged PETH in the bottom panel). C, leaveDecisionActivity from the model (top), next to the second PC of ACC activity (second panel), and an example unit with a strong loading for the second PC (trial-by-trial raster in the third panel and trial-averaged PETH in the bottom panel). PETHs are locked to the time of decisions (the lever press or nose poke). PETHs of leaky accumulator model decision variables were created from simulations using parameters fit to each rat, lines and ribbon represent the average across these simulations. D, Cumulative proportion of variance explained by each PC. E, The proportion of individual units that correlated with each model variable. As many units exhibited significant correlations with multiple model variables, units were assigned to the variable with which they exhibited the strongest correlation.

