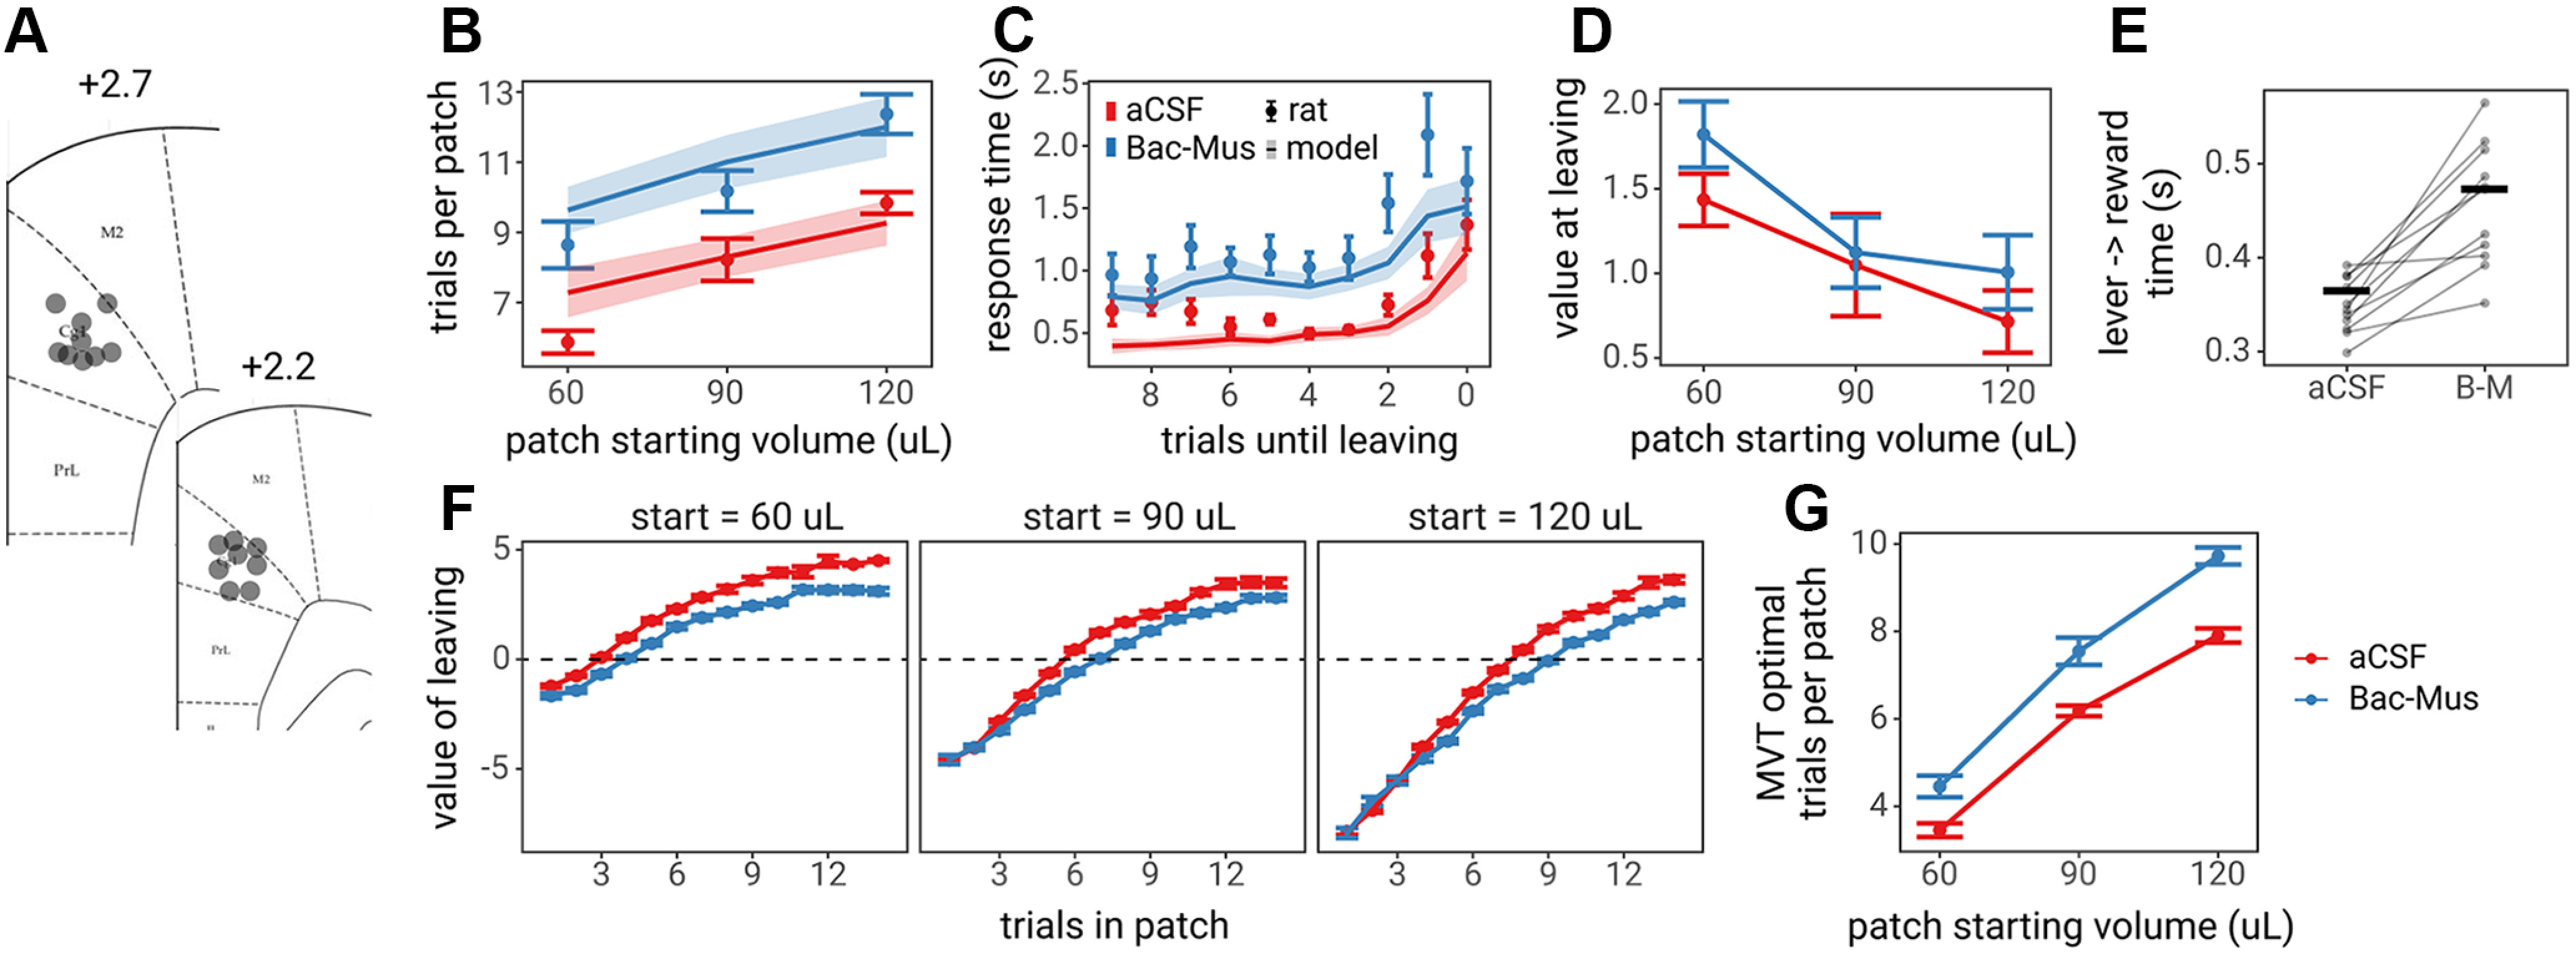
Figure 8.

Effects of Inactivation of ACC on foraging behavior. A, Diagram of cannula locations in Cg1. B, The number of trials spent in each of the three patch types. C, RTs as rats became closer to leaving patches, where 0 trials until leaving is the nose poke to leave the patch, 1 is the last lever press in the patch, and so on. D, The value of leaving (global reward rate – local reward rate) the rat experienced on the last trial in which they harvested reward from the patch (trials until leaving = 1). In B–D, points and error bars represent the mean and SE across rats, whereas lines and ribbons represent mean and SE across leaky accumulator model predictions for each rat. E, The handling time or time from lever press to entering the reward magazine. Transparent points and lines represent individual rat behavior, and the horizontal bar shows the mean across rats for each condition. F, The value of leaving (global reward rate – local reward rate) over the course of trials in the patch for each of the three patch starting reward volumes. Points and error bars represent the mean and SE across rats. The horizontal dashed line represents the optimal time to leave patches (global rate – local rate = 0), according to MVT. G, Extrapolating from F, the optimal time to leave patches in the aCSF and Bac-Mus conditions, according to MVT.
