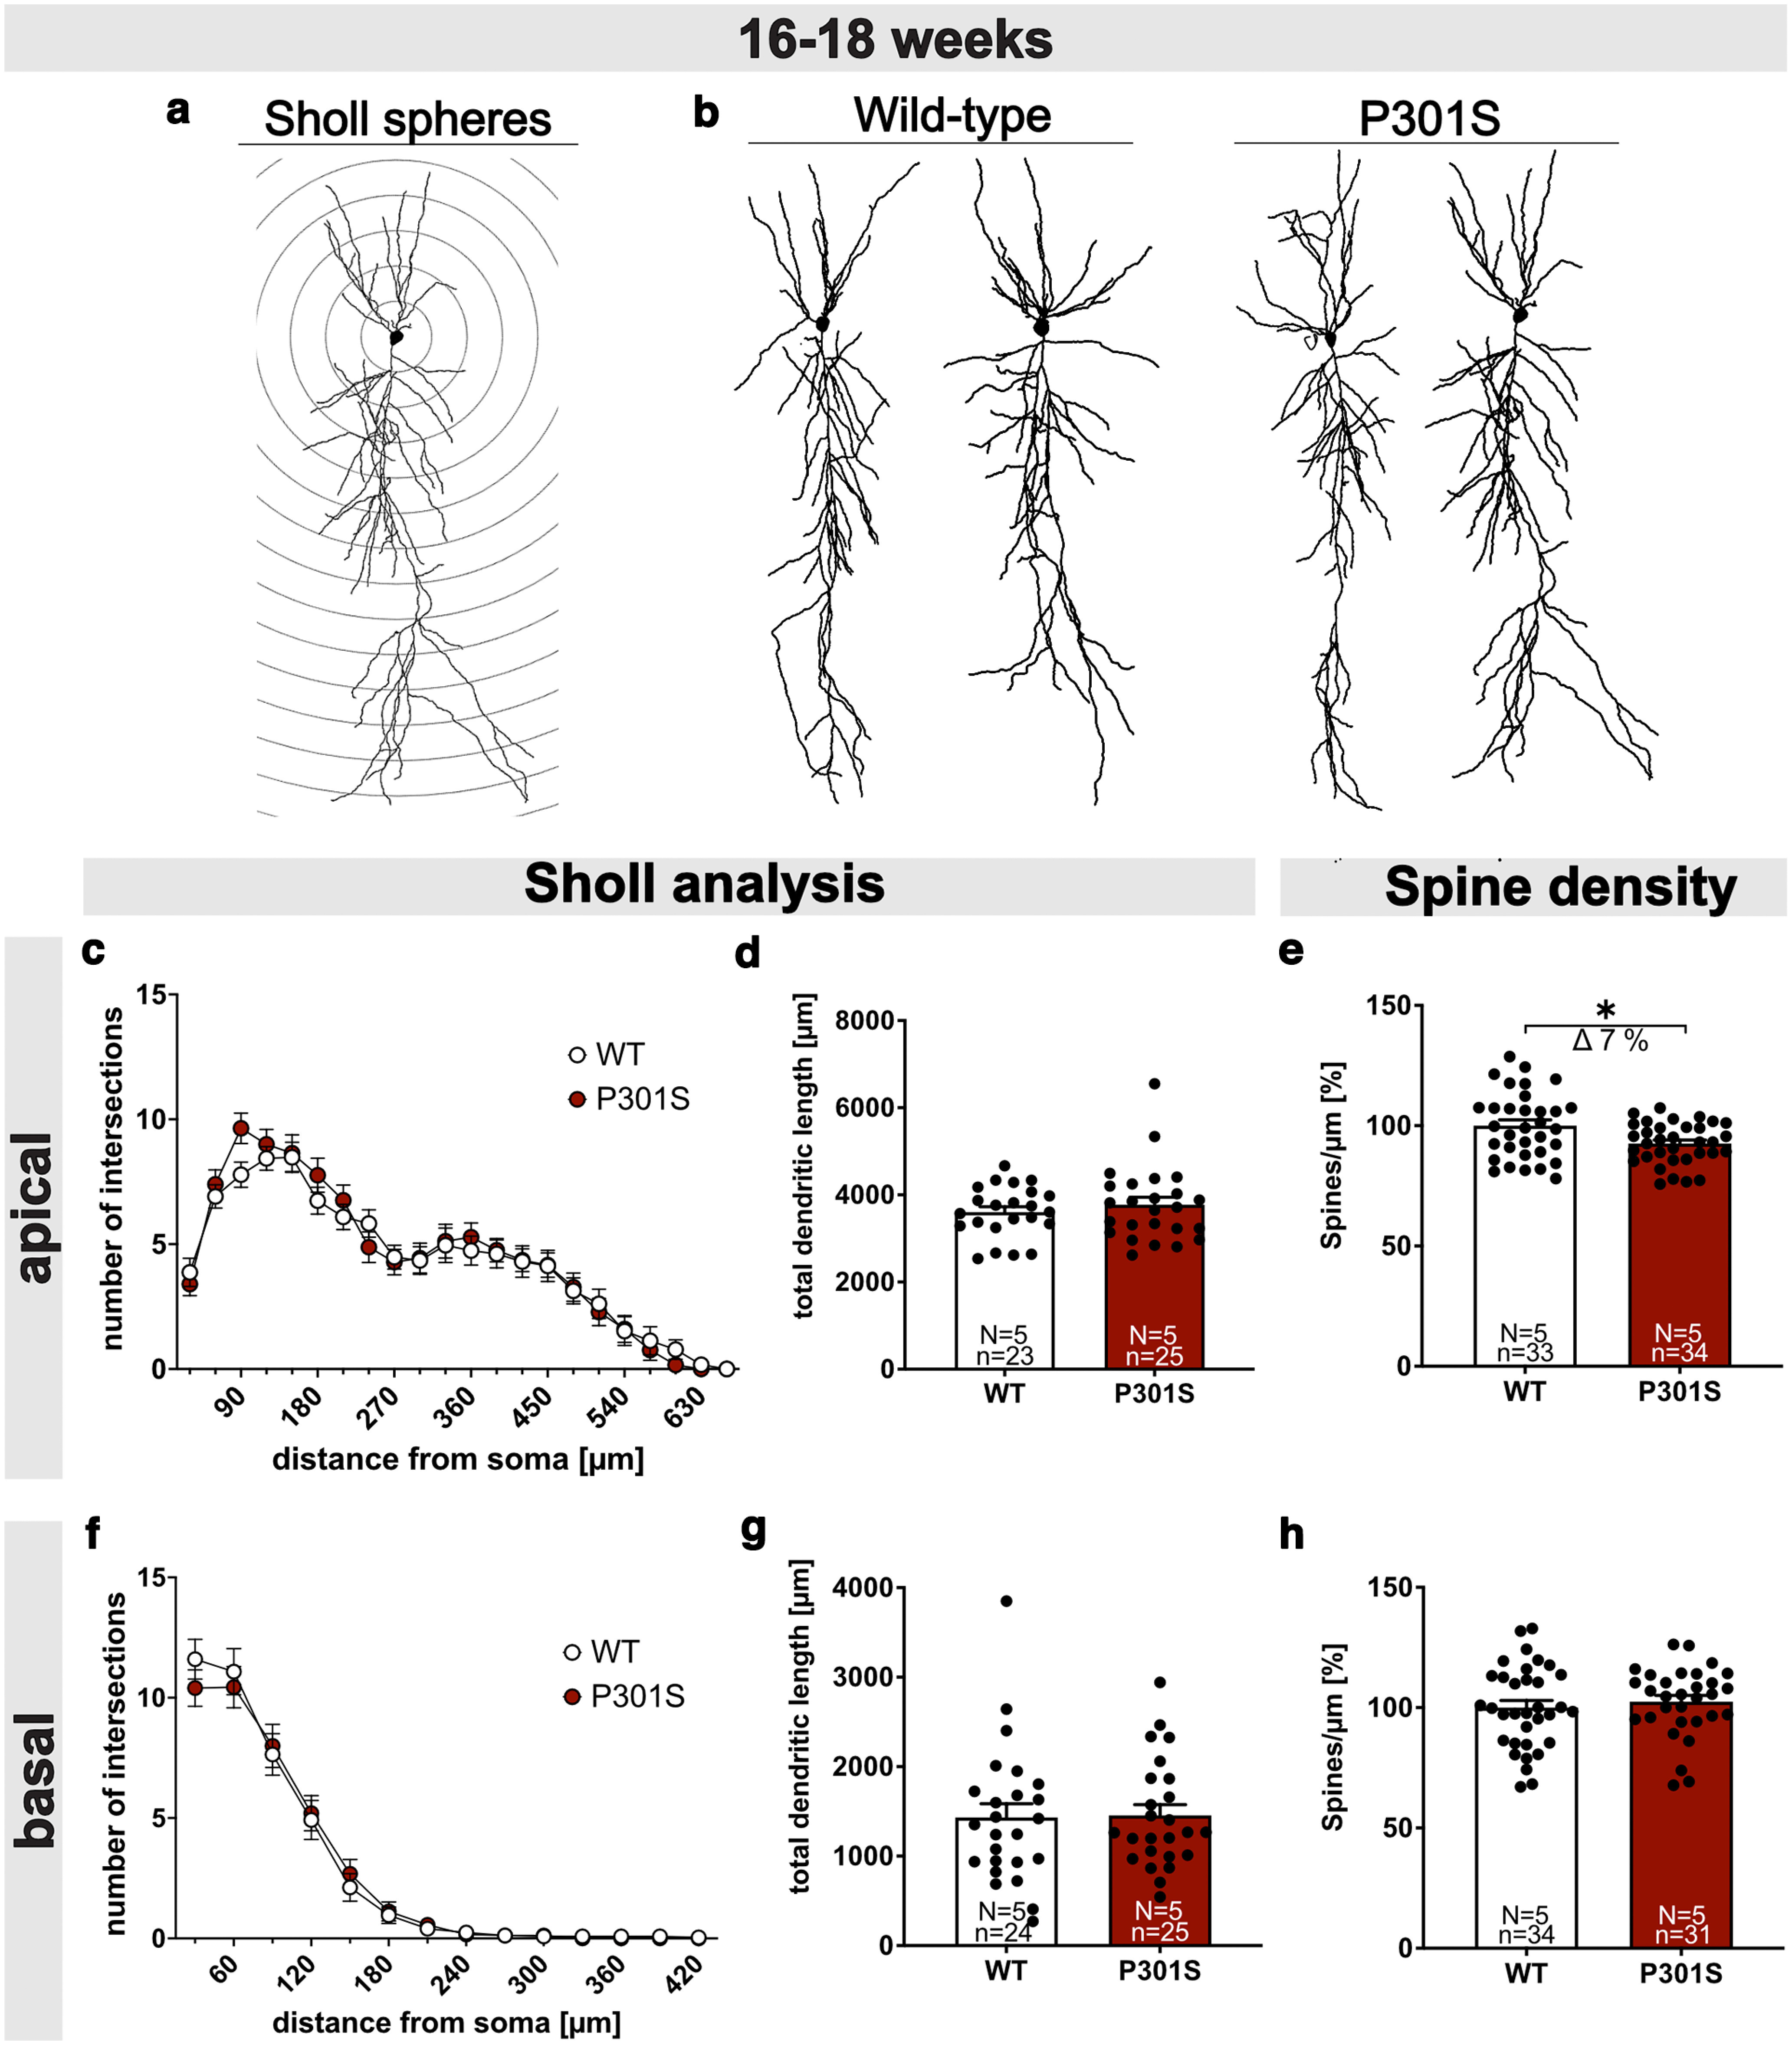
Figure 3.

P301S mice show reduced spine density but normal neuronal morphology. a, Schematic representation of Sholl spheres around the soma (radius increment 30 µm). b, Representative 3D reconstructions of CA1 pyramidal neurons from WT (left) and P301S mice (right). c-e, Sholl and spine density analysis in apical dendrites. Sholl analysis of Biocytin-filled CA1 pyramidal cells revealed no differences in the number of intersections (c) and total dendritic length (d) of apical dendritic segments between WT and P301S mice. e, The spine density of apical dendrites was reduced by 7% in 16- to 18-week-old P301S mice compared with WT mice (WT vs P301S, *p = 0.0104). f-h, Sholl and spine density analysis in basal dendrites. Sholl analysis revealed no differences in the number of dendritic intersections (f), total dendritic length (g), and spine density (h) between WT and P301S mice at the age of 16-18 weeks. Data are mean ± SEM. n = number of neurons; N = number of animals. Data were analyzed by Student's t test: *p < 0.05.
