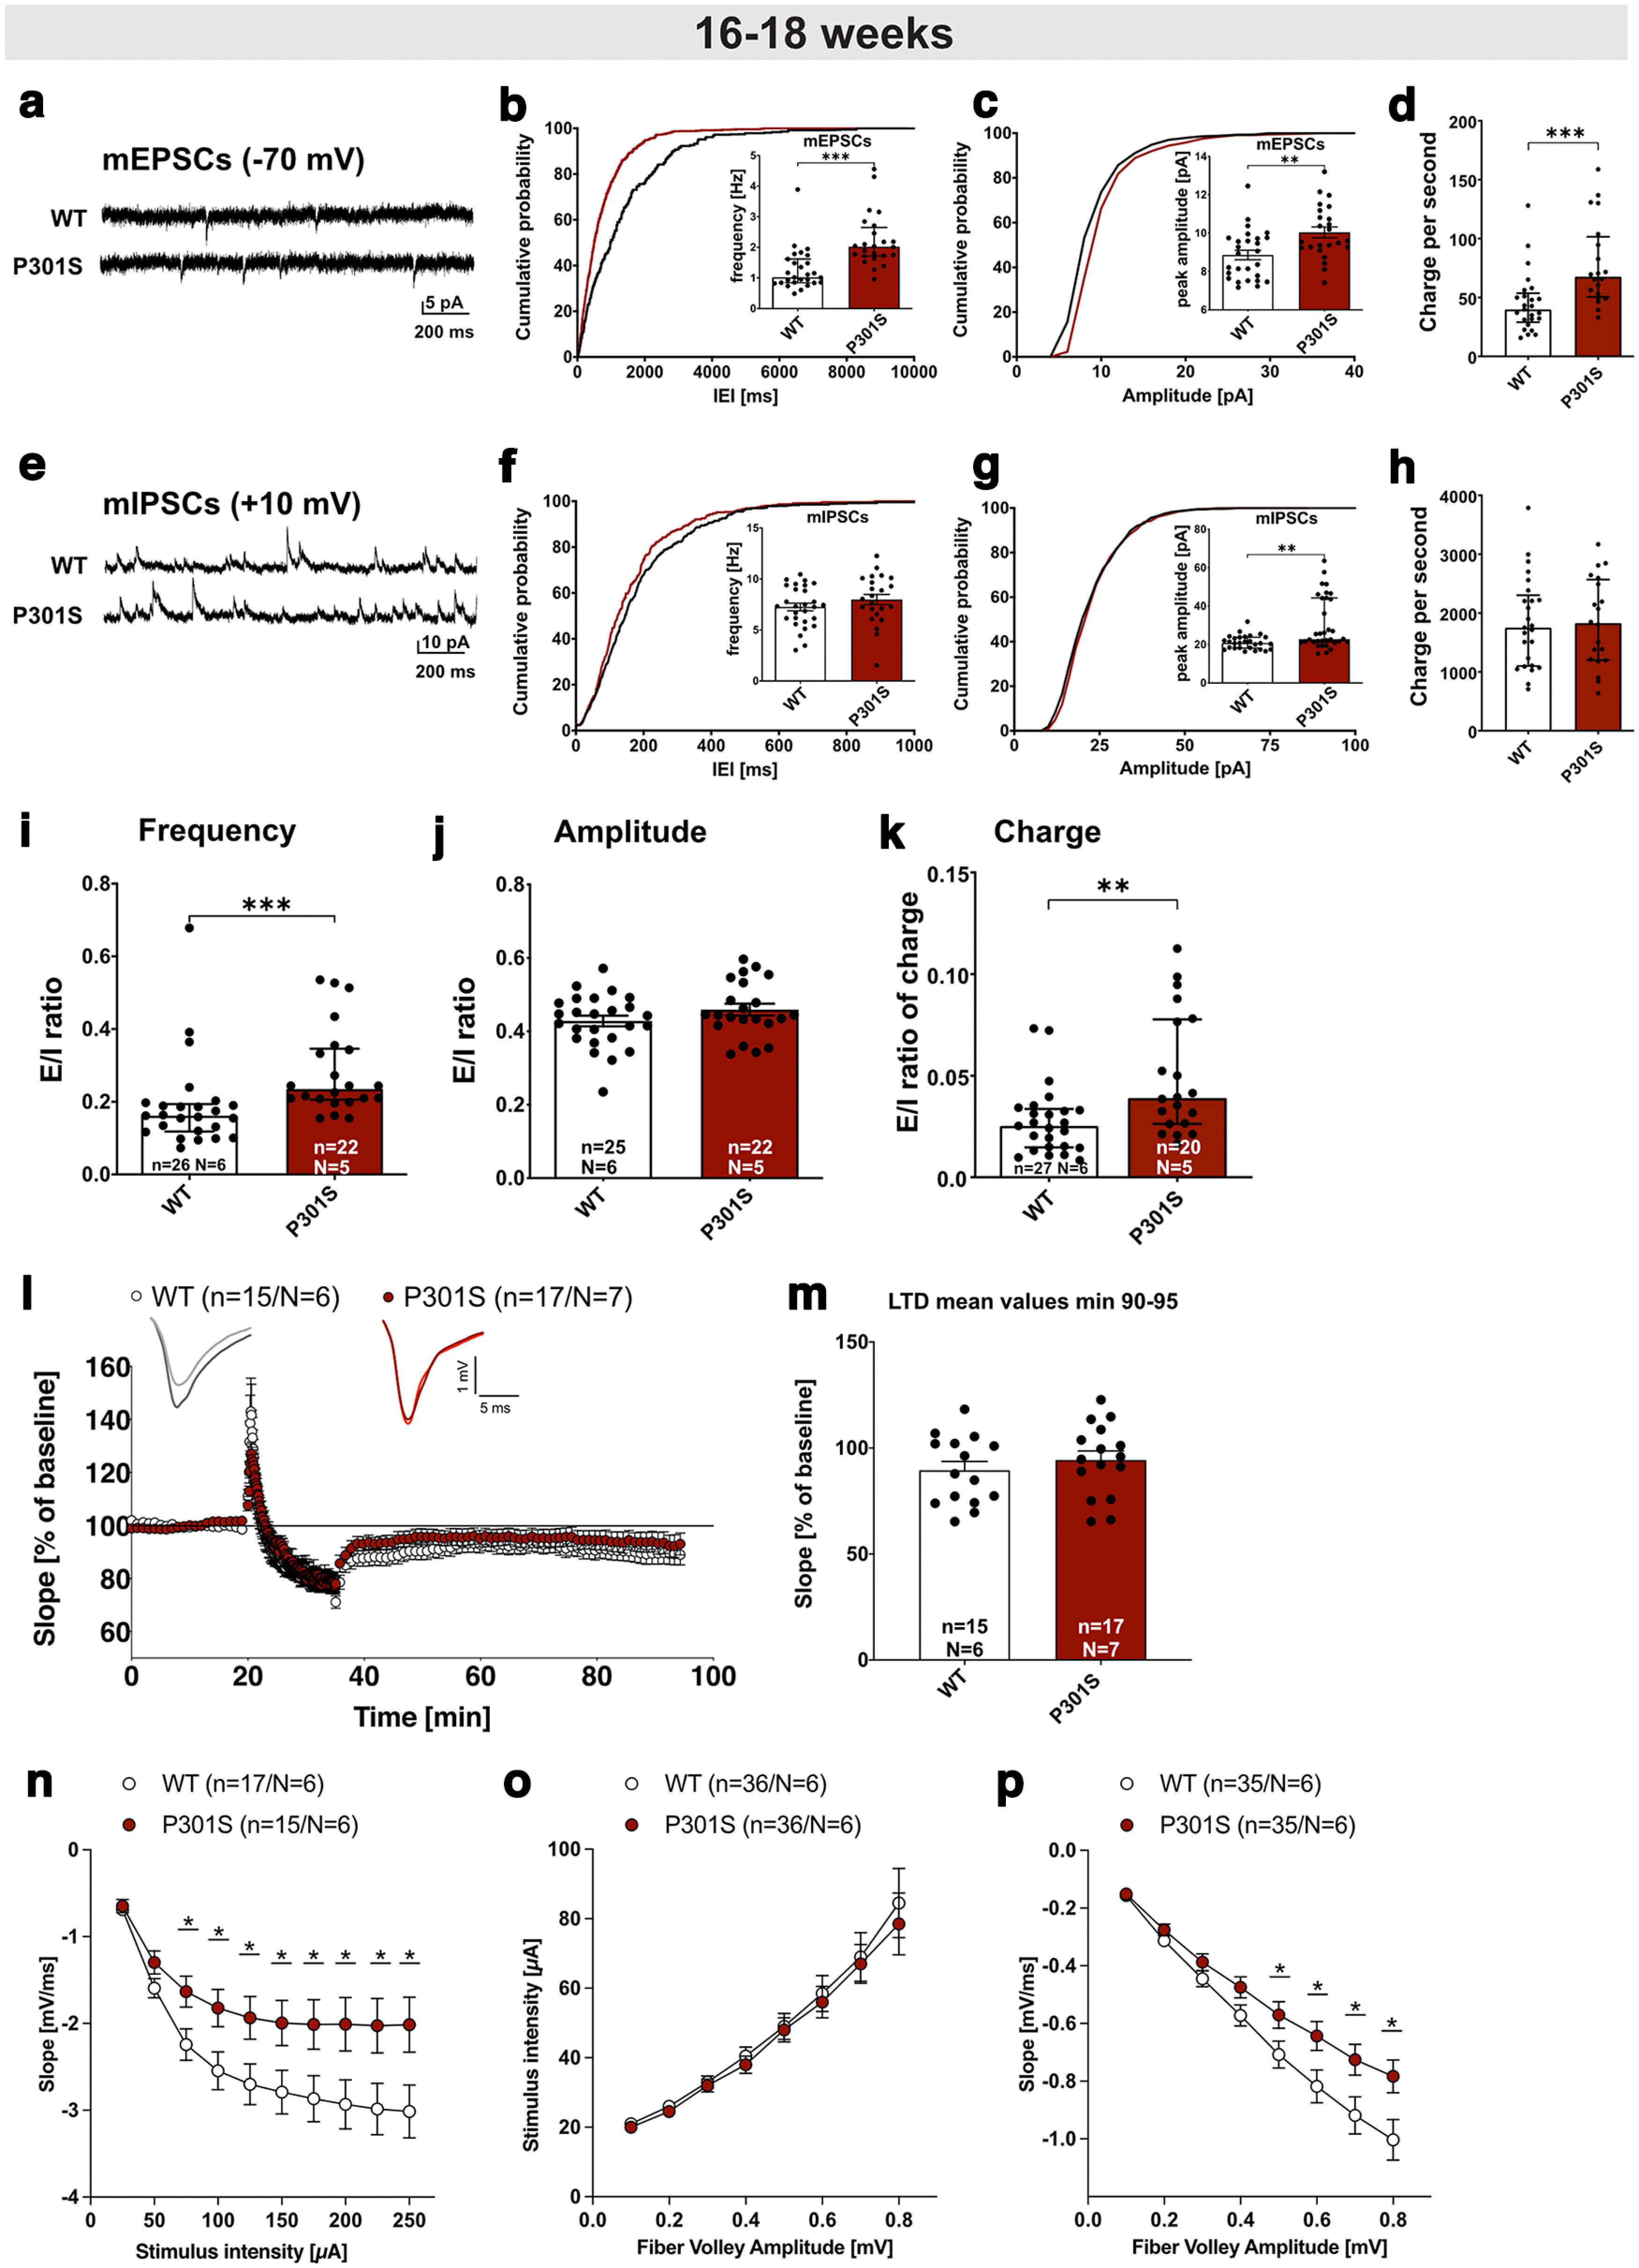
Figure 4.

Electrophysiological analysis reveals impaired hippocampal network function in P301S mice. a, mEPSC sample traces of recordings from CA1 pyramidal cells, measured at −70 mV. b, Cumulative distribution plot of mEPSC interevent intervals (IEI) and bar graph of mEPSC frequencies. The cumulative distribution of IEIs is shifted to the left in P301S mice, consistent with the increased mEPSC frequency in CA1 neurons of P301S mice (n = 24, N = 5) compared with those of WT mice (***p < 0.0001, n = 27, N = 6). c, mEPSC amplitude was increased in CA1 pyramidal cells of P301S mice (n = 24, N = 5) compared with WT cells (**p = 0.0028, n = 27, N = 6). d, mEPSC charge transfer per second was increased in pyramidal cells of P301S mice (n = 20, N = 5) compared with WT cells (***p = 0.0001, n = 27, N = 6). e, mIPSC sample traces of recordings from CA1 pyramidal cells, measured at 10 mV. f, mIPSC frequency was not different in CA1 pyramidal neurons of P301S mice (n = 23, N = 5) vs WT cells (not significant, n = 28, N = 6). g, mIPSC amplitude was increased in CA1 pyramidal cells of P301S mice (n = 34, N = 5) compared with WT neurons (**p = 0.0023, n = 26, N = 6). h, mIPSC charge transfer per second was unchanged in pyramidal cells of P301S mice (n = 20, N = 5) compared with WT cells (p = 0.9818, n = 27, N = 6). i, j, E/I ratios of mEPSC/mIPSC frequencies were higher in neurons of P301S mice compared with WT neurons (***p = 0.0002), while the E/I ratio of mEPSC/mIPSC amplitudes was not altered (not significant). k, E/I ratio of charge transfer was increased in neurons of P301S mice compared with WT neurons (**p = 0.0027). Data are represented as median ± SD for normally distributed data and median ± IQR for not normally distributed data. n = number of recorded cells; N = number of animals. l, m, After 20 min baseline recording, LTD was induced by application of a low-frequency stimulus (LFS, 1 Hz) for 15 min. LTD was indistinguishable between P301S and WT mice (not significant, 55-60 min after LFS). n, fEPSP amplitudes were reduced in P301S mice compared with WT mice reaching significance at a stimulus intensity of 75 μA (*p = 0.028 for 75 µA). o, When the stimulus intensity was compared with the FV amplitude, there was no difference between the WT and the P301S group. p, The fEPSP slope at FV amplitudes between 0.5 and 0.8 V was reduced in P301S mice compared with WT mice (*p = 0.042 for 0.5 mV). Data are mean ± SEM. n = number of recorded slices; N = number of animals. Data were analyzed using either Student's t test (k-m) or one-way ANOVA with Bonferroni's post hoc test and Bartlett's test for equal variances: *p < 0.05; **p < 0.01; ***p < 0.001.
