Figure 5.
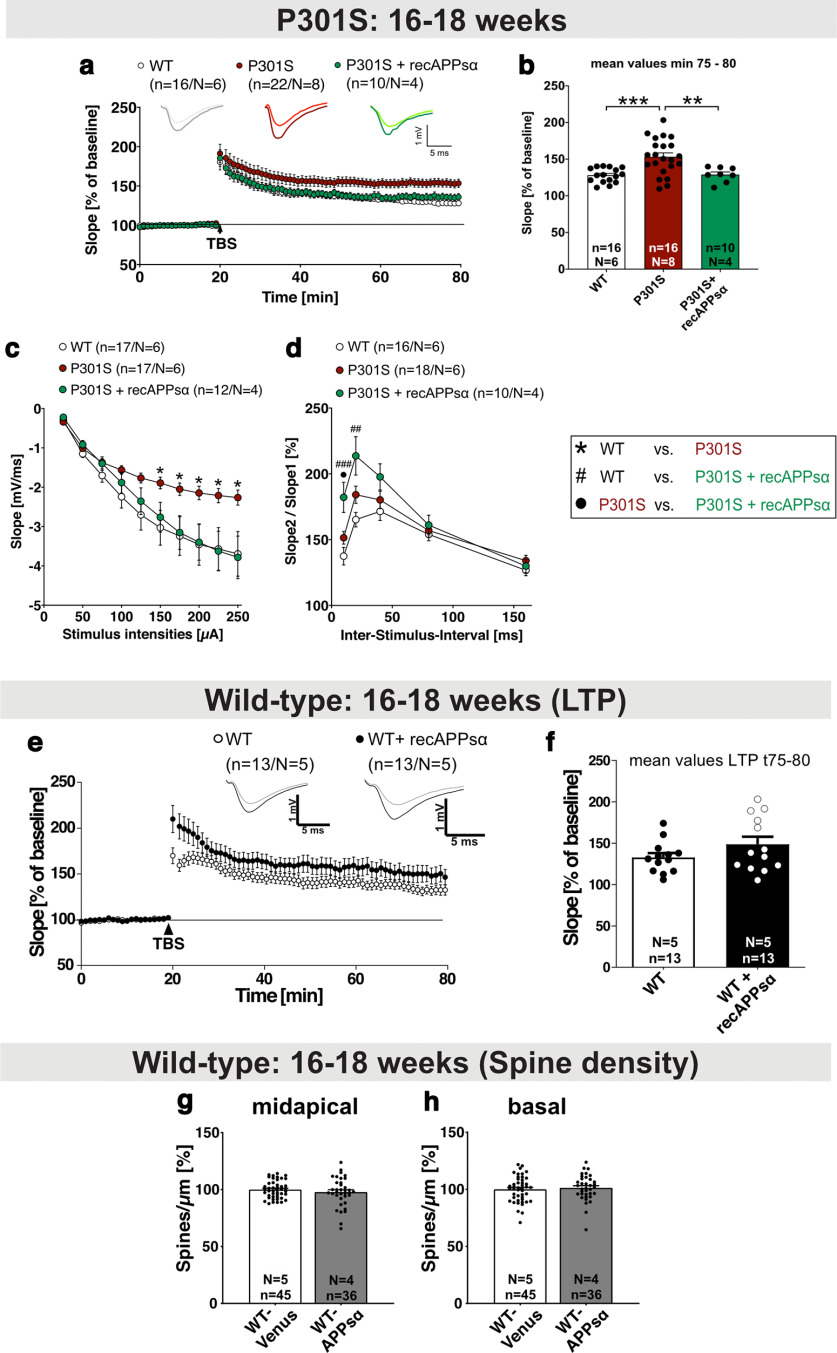
Aberrantly increased LTP in P301S mice is rescued by application of recAPPsα. a, b, After 20 min baseline recording, LTP was induced by application of TBS (arrow). P301S mice at the age of 16-18 weeks displayed a significantly higher LTP than WT mice (min 75-80, ***p = 0.0005). The application of recombinant APPsα (10 nm) normalized the elevated LTP values of P301S mice to WT level (WT-Venus vs P301S+recAPPsα: not significant; P301S vs P301S+recAPPsα: **p = 0.0085). The LTP induction rate is shown as percentage (%) of mean baseline slope. c, fEPSP amplitudes were smaller in P301S mice compared with WT mice reaching significance at a stimulus intensity of 150 μA (*p = 0.0145 for 150 µA). When APPsα was applied, the neuronal excitability in P301S slices and WT slices was comparable at all stimulus intensities. d, PPF was not different between the WT and the P301S group. PPF was quantified by the ratio of the slopes of EPSPs evoked by two stimuli with different ISI. APPsα treatment led to the highest PPF curve within that paradigm, reaching significance at the 10 and 20 ms ISI (10 ms, WT vs P301S: not significant, WT vs P301S+recAPPsα: ###p = 0.0008, P301S vs P301S+recAPPsα: •p = 0.0201; 20 ms, WT vs P301S: not significant, WT vs P301S+recAPPsα: ##p = 0.0018, P301S vs P301S+recAPPsα: not significant). e, f, Application of recAPPsα (10 nm) does not significantly affect LTP in WT mice (age 16-18 weeks). LTP was induced by application of TBS (arrow). The LTP induction rate is shown as percentage (%) of mean baseline slope. Data are mean ± SEM. n = number of recorded slices; N = number of animals. Data were analyzed by Student's t test: *p < 0.05; **p < 0.01; ***p < 0.001. g, h, AAV-APPsα expression in the hippocampus of WT mice (age 16-18 weeks; also see Fig. 7a,b) does not alter spine density in midapical (g) and basal dendrites (h) of CA1 neurons. Data are mean ± SEM. n = number of analyzed dendritic segments; N = number of animals. Data were analyzed by Student's t test.

