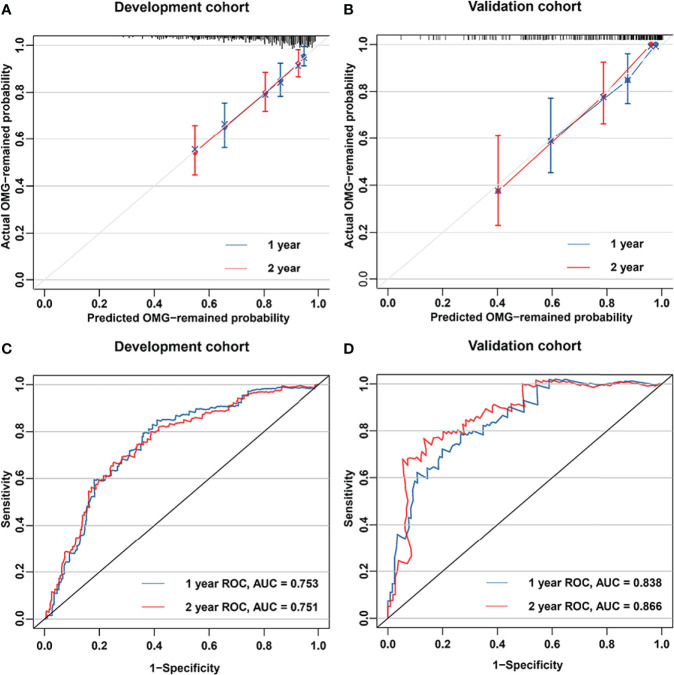
Figure 3.
Nomogram performance. Calibration plots for estimating 1- and 2-year generalization probabilities are presented for the development cohort (A) and validation cohort (B). The x- and y-axes represent the nomogram-predicted and actual generalization probabilities, respectively. The 45° grey line is the reference line indicating a perfect calibration. The blue and red lines represent the nomogram-predicted 1- and 2-year generalization probabilities, respectively. Areas under the curves of the model for predicting 1- and 2-year generalization probabilities in the development cohort (C) and validation cohort (D). The red and blue lines represent the nomogram-predicted 1- and 2-year generalization probabilities, respectively.

