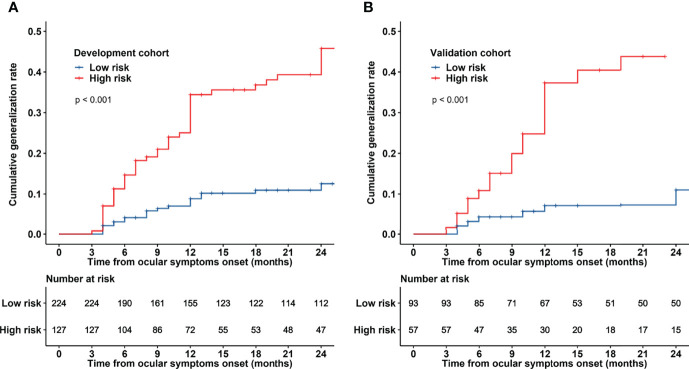
Figure 4.
Kaplan−Meier curves for patients with OMG based on risk group stratification in the development and validation cohorts. Patients were stratified into low- and high-risk generalization groups based on the optimal cut-off value (26%). Two-year cumulative generalization rates are presented for the development cohort (A) and validation cohort (B).

