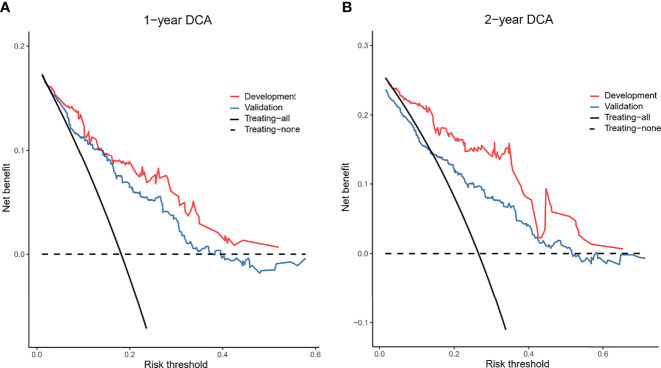
Figure 5.
Decision curves of the nomogram model. In the figure, the abscissa is the threshold probability, and the ordinate is the net benefit rate. The horizontal image indicates net benefit when all patients with OMG are considered have not developing generalization and not treated. The oblique image indicates net benefit when all patients with OMG are considered having develop generalization and treated. (A, B) depict the decision curves predicting the 1- and 2-year generalization probabilities in the development and validation cohorts, respectively.

