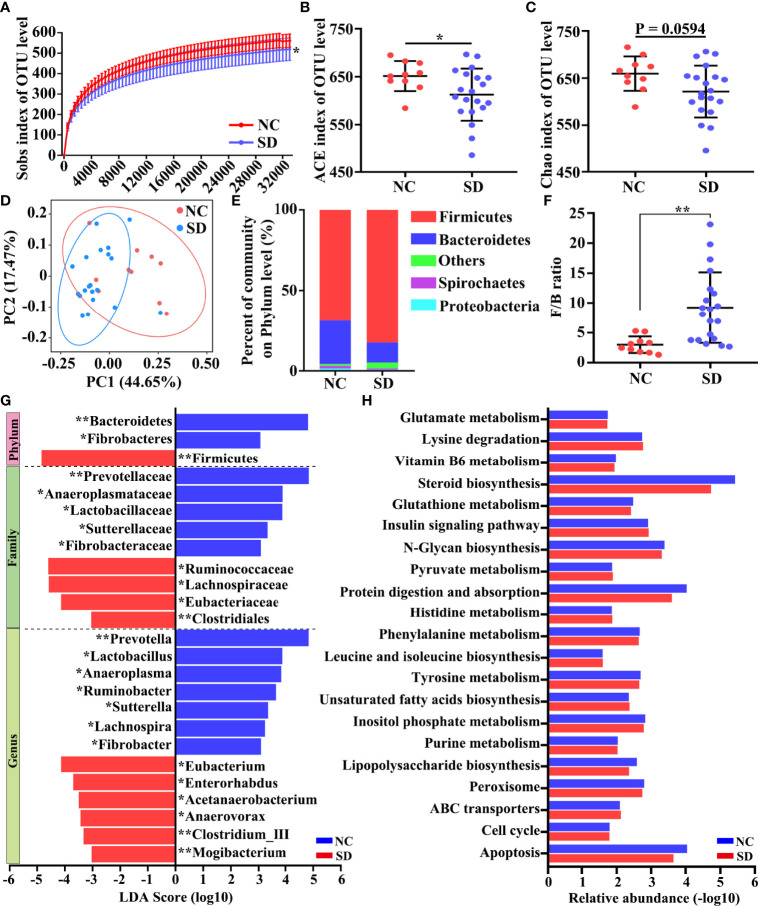
Figure 2.
Effects of sleep deprivation (SD) on intestinal microbial community structure in rhesus monkeys (RMs). (A) Rarefaction curves for the gene number in the control (n = 10) and SD (n = 20) groups. The curve in each group is nearly smooth with a sufficient amount of sequencing data and a few new undetected genes. (B, C) ACE and Chao indices were used to estimate the α-diversity of the gut microbiota community. (D) Principal coordinate analysis showed that there is a distinct clustering of microbial community composition between SD and the control group. (E) The relative abundance of gut microbiota at the phylum level was clustered into different groups. This analysis included only phyla with relative abundances greater than 0.5%. All OTUs with low abundances were grouped as “others”. (F) The ratio of Firmicutes to Bacteroidetes in the SD RMs and controls. (G) The differential microbiota community between these two groups was identified by LEfSe methods. The enriched taxa of SD RMs were indicated with a negative LDA score (red), and the enriched taxa of controls were indicated with a positive LDA score (blue). Only taxa meeting a significant LDA threshold value of >3 are shown. (H) The differential KEGG pathways based on differential bacteria were shown. Differences were denoted as follows: *p < 0.05; **p < 0.01. NC, normal control group.

