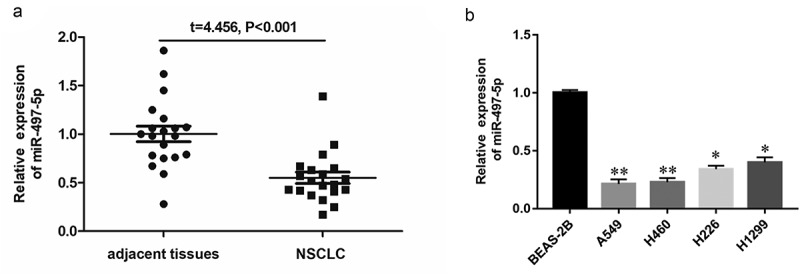
Figure 1.

Expression of miR-497-5p in NSCLC tissues and different cell lines. (a) Expression of miR-497-5p in NSCLC tissues (n = 30) and adjacent normal tissues (n = 30) were measured by RT-qPCR. U6 was used as an internal reference. (b) Expression of miR-497-5p in different NSCLC cell lines. Statistical significance was determined using an independent sample t-test. Values are expressed as means ± SEM, n = 5. * P < 0.05 and ** P < 0.01 vs. normal or control.
