
Figure 1.
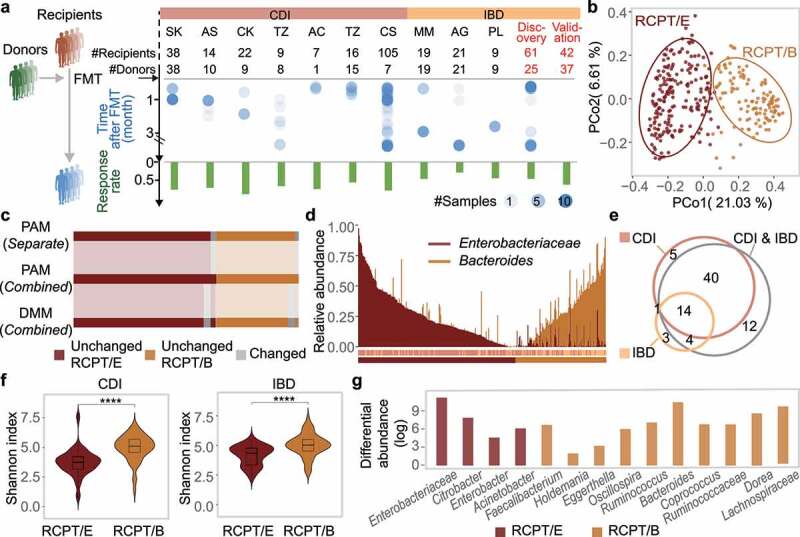
Enterotype analysis in CDI and IBD patients reveals consistency between the two diseases. (a) Outline of cohort collection for FMT to treat CDI and IBD. Only studies that provide detailed metadata about FMT outcomes are depicted. Each column represents one analyzed cohort, denoted by the study’s first author’s abbreviated name. “Discov.” and “Val.” indicate our recruited cohorts for discovery and validation, respectively. “#” and dot size represent the number of sample size in each cohort, blue dots represent samples from recipients after FMT. (b) Bray-Curtis beta-diversity ordination of samples from CDI and IBD patients (n = 322 stool samples). RCPT/E (dark red) and RCPT/B (Orange) are the two enterotypes clustered by enterotype tutorial. (c) Distribution of unchanged and variable individuals among three approaches of enterotype clustering (partitioning around medoids (PAM) separate, PAM combined and Dirichlet multinomial mixtures (DMM) combined). “Unchanged” means that the individual gets the same enterotype with two approaches, and “variable” vice versa. (d) Relative abundance distribution of two enterotype dominant bacteria (RCPT/E and RCPT/B). Enterobacteriaceae represents the dominant genus in RCPT/E. (e) The number of enterotype-associated genera in different approaches (Wilcoxon test, q < 0.0001). “CDI” means including only individuals with CDI to obtain enterotype-associated genera, “IBD” means including only IBD, and “CDI & IBD” means both diseases. (f) Alpha diversity between two enterotypes in CDI and IBD. The boxplot center represents median, and the box shows the interquartile range (IQR). Whiskers extend to the most extreme data point < 1.5 x IQR. Asterisks indicate significance (****p < .0001, ***p < .001). (g) Differential abundance of 14 enterotype-characteristic taxa in two enterotypes (Wilcoxon test, q < 0.0001). Differential abundance was calculated by subtracting the mean relative abundance between two enterotypes for each enterotype-characteristic taxon. Family name represents the genus for f__Family name; g__. The enterotype-characteristic taxa are sorted according q value. All q value represents the p value adjusted by the Benjamini-Hochberg false discovery rate.