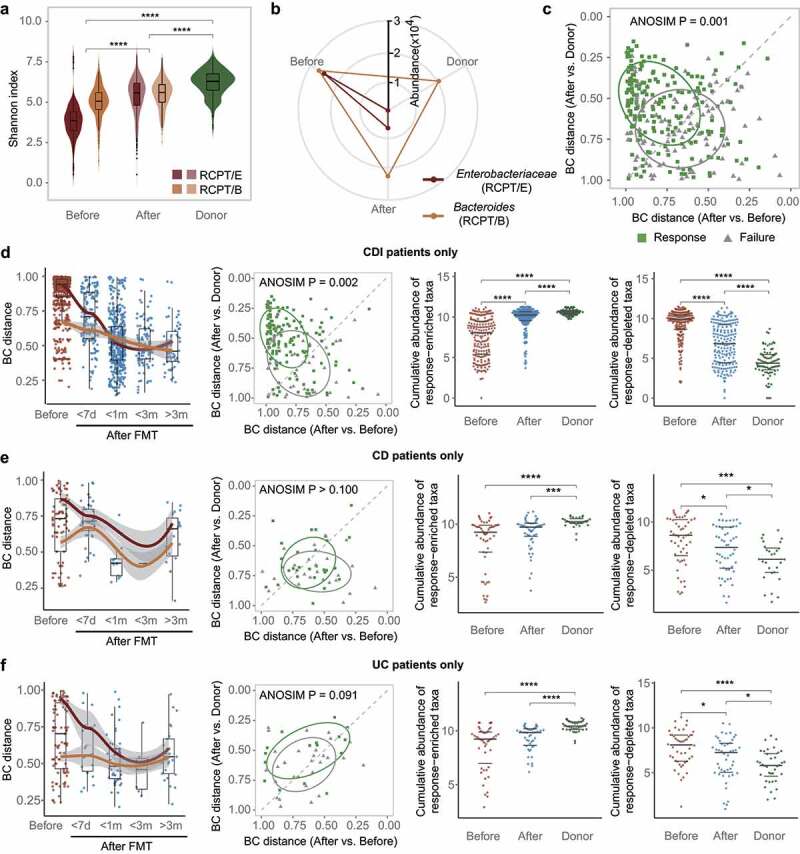
Figure 2.

FMT outcome was significantly associated with the microbiota distance between recipient and donor. (a) Comparisons of alpha diversity in individuals with two enterotypes and donors across time in FMT (n = 322). (b) Relative abundance variation of the dominant genus during FMT. Enterobacteriaceae represents the dominant genus in RCPT/E. (c) Distribution of recipients in different FMT outcome groups (response and failure) (n = 286). The two coordinates represent the BC distance between the recipient after FMT and the same recipient before FMT or their donor before FMT, respectively. The green and gray points represent the response and failure of FMT, respectively. ANOSIM was performed for the two groups (response and failure) (ANOSIM test, statistic = 0.11, p = .001). (d-f) Analyses were reproduced in CDI recipients (d), IBD subtype CD recipients (e) and IBD subtype UC recipients (f). Left: Community variability was determined by the Bray-Curtis (BC) distance over time during FMT. The red and blue dots represent the BC distance between the recipient and its donor before and after FMT. The two lines fit the trends of RCPT/E and RCPT/B, respectively. Middle: Distribution of recipients in different FMT outcome groups. Right: the cumulative abundance of significantly response-enriched or response-depleted taxa in donors and patients before FMT (Wilcoxon test, q < 0.05). The q value represents the p value adjusted by the Benjamini-Hochberg false discovery rate. Cumulative abundance was calculated by summing all genera that were significantly enriched or depleted in the response group. Asterisks indicate significance (****p < .0001, ***p < .001, **p < .01, *p < .05).
