Figure 4.

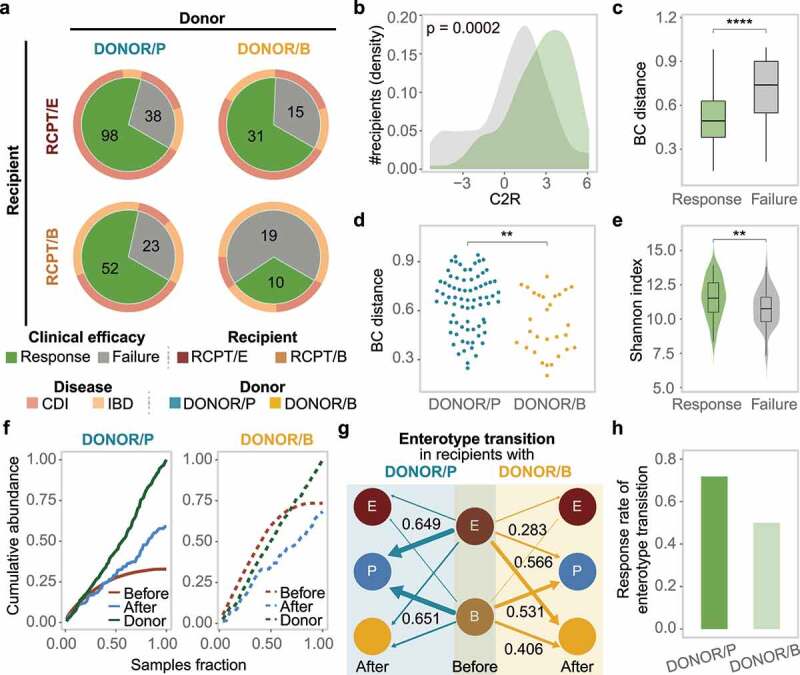
Enterotype-based donor-recipient matching contributes to FMT success. (a) FMT efficacy for different enterotypes of recipients and donors (n = 286). The statistic represents the number of patients who received FMT. (b-c) C2R (b) and Bray-Curtis (BC) distance (c) between the response and failure groups of RCPT/E after FMT (n = 182). The density of the number of recipients was depicted in the y-axis (b). (d) BC distance between RCPT/B patients and donors of DONOR/P or DONOR/B (n = 104). (e) The summed alpha diversity between the response group and the failure group of RCPT/B (n = 104). The summed alpha diversity was calculated by summing the Shannon alpha diversity of paired recipients and donors. (f) The cumulative abundance curve of donor-specific genera in recipients or donors during FMT. Donor-specific genera were those with significant differences in abundance between DONOR/P and DONOR/B (Wilcoxon test, q < 0.05). Cumulative abundance was calculated by summing corresponding donor-specific genera in recipients before or after FMT. To make this measure comparable between the two donor enterotypes, the cumulative abundance was normalized to the level of corresponding donors separately (DONOR/P or DONOR/B). The sample fraction was normalized by the number of recipients in each group (transplanted by DONOR/P or DONOR/B). (g) Enterotype transition in recipients treated with different donors (DONOR/P and DONOR/B). Blue and yellow lines represent DONOR/P and DONOR/B, respectively. The number represents the fraction of enterotype transitions, and only fractions higher than 0.25 are depicted. (h) The response rate of recipients with enterotype transition. DONOR/P and B represent the enterotypes of the donor for the recipients. Asterisks indicate significance (****p < .0001, ***p < .001, **p < .01, *p < .05).
