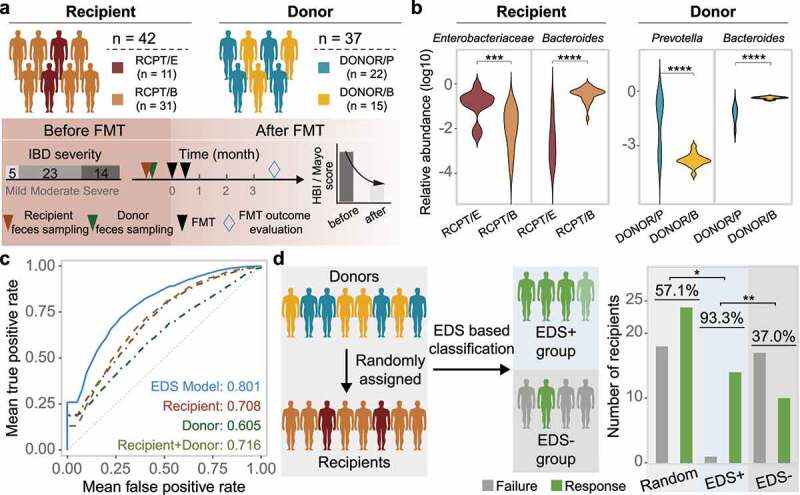
Figure 5.

Construction and validation of the enterotype-based donor selection model. (a) Outline of the validation cohort (n = 42). Characteristics of recipient and donor are depicted in the upper and bottom panel. Response rate was determined based on a at least 3-month follow-up for each recipient. (b) Dominant taxa of recipients and donors from different enterotype in the validation cohort. Enterotype of each individual was assigned by the medoids of the known enterotypes. Enterobacteriaceae represents the dominant genus in RCPT/E. (c) Receiver-operating characteristic (ROC) curves for the enterotype-based donor selection (EDS) model and other alternative models by 5-fold cross-validation with 500 iterations in CDI and IBD (n = 286). (d) The performance of the EDS model in the validation cohort (n = 42). The left panel depicts the schema of donor assignment (the random group) and by the EDS model (the EDS group). The right panel depicts the distribution of FMT outcomes (response and failure) in the random group and the EDS group. Asterisks indicate significance (****p < .0001, ***p < .001, **p < .01, *p < .05).
