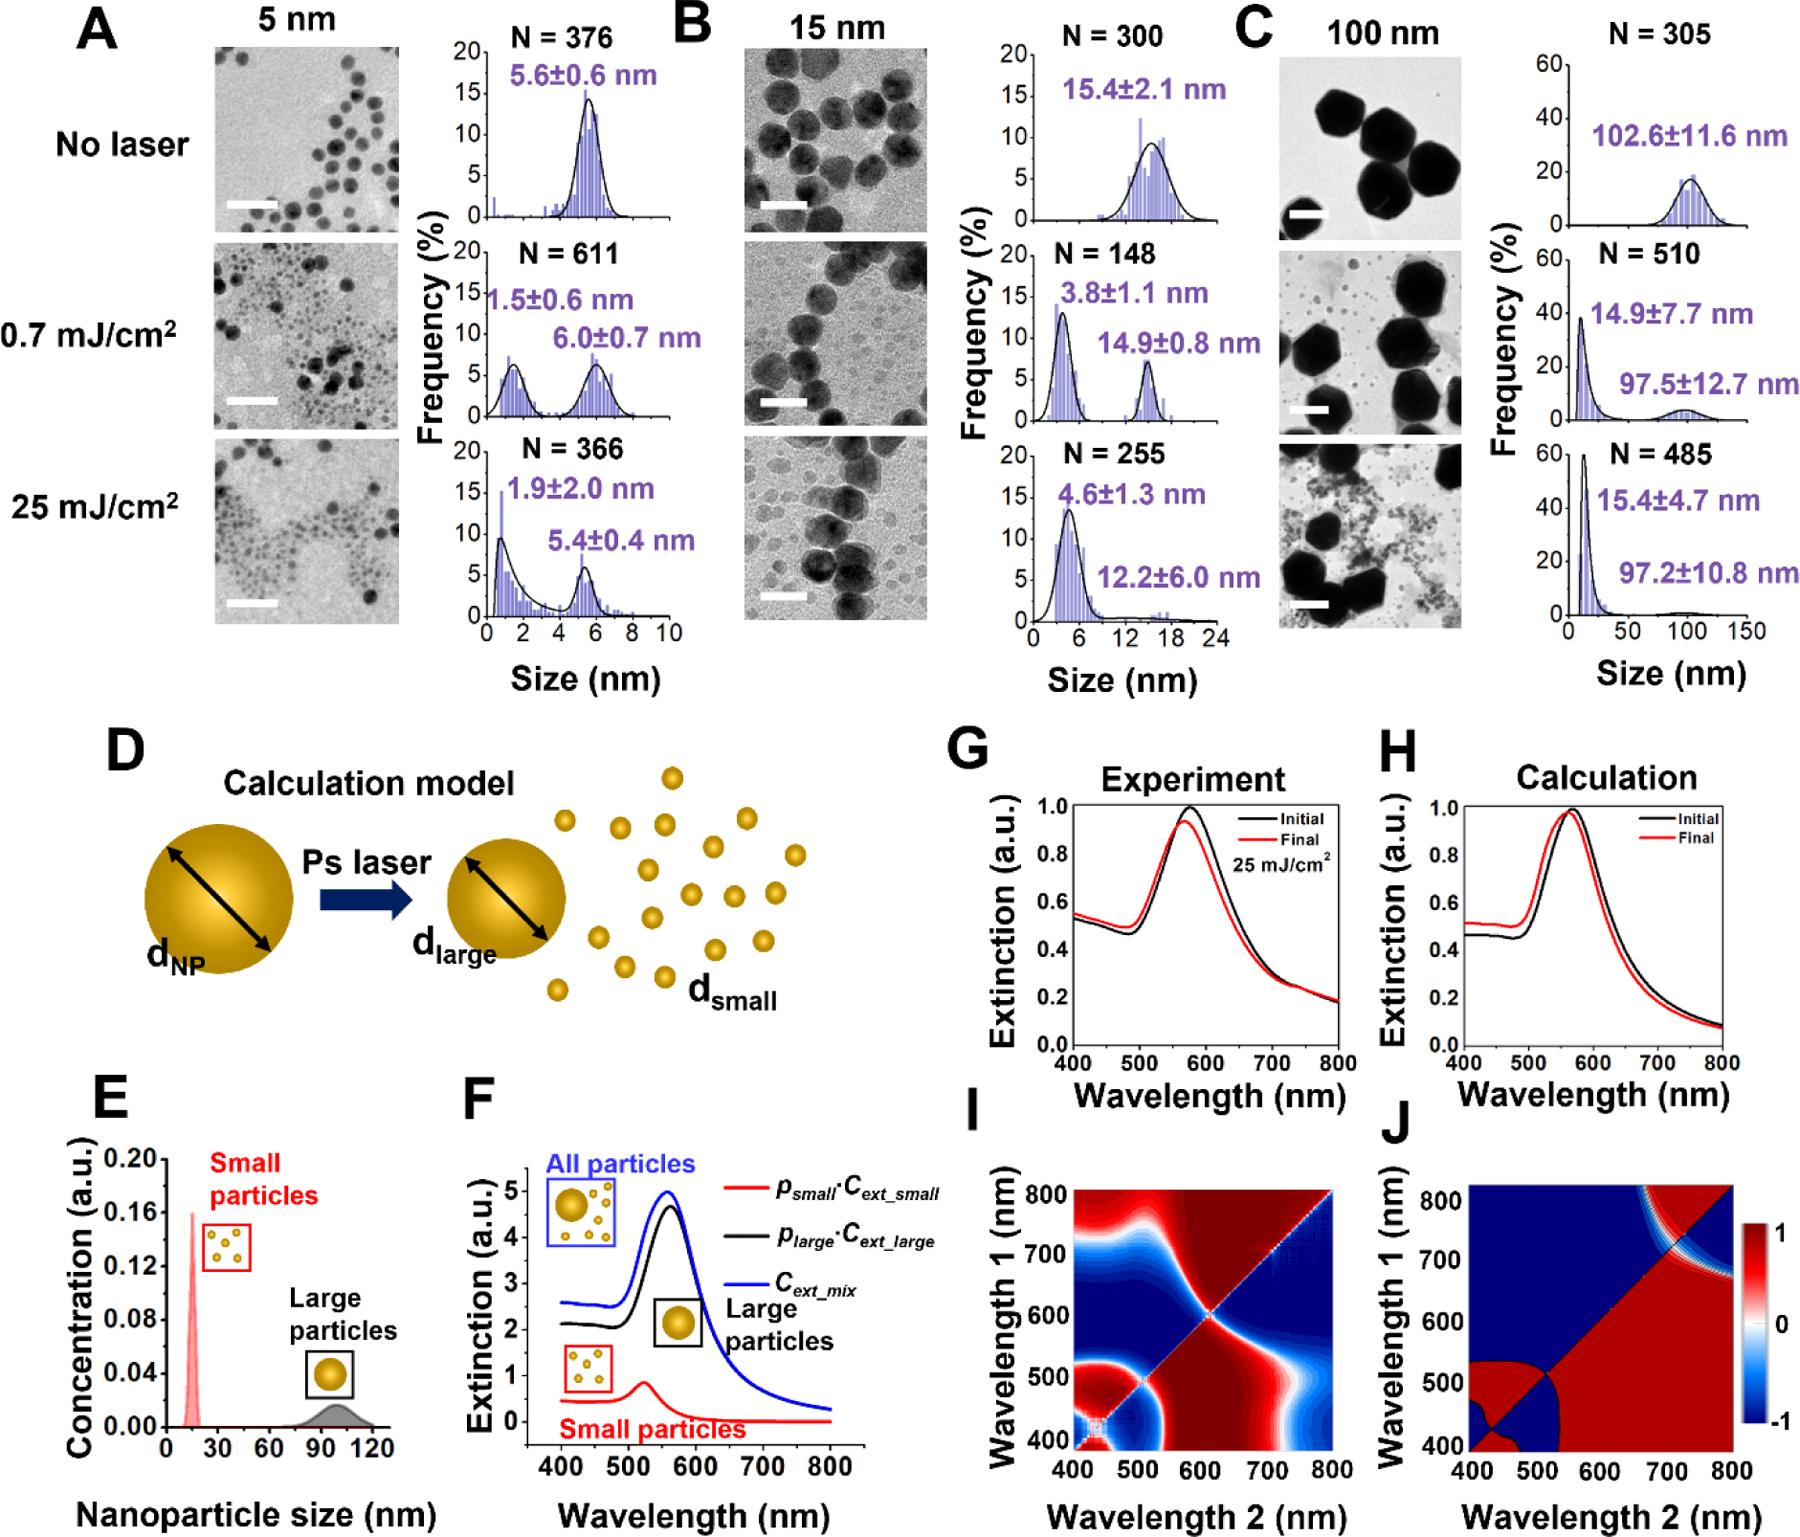
Figure 2. Bimodal size distribution for fragmentation under picosecond laser.

TEM images and particle size distribution before and after picosecond laser irradiation for (A) 5 nm, (B) 15 nm and (C) 100 nm AuNPs. Scale bars are 20 nm for TEM images in (A) and (B) and 100 nm for TEM images in (C). Small particles with a relatively uniform size form after picosecond laser pulse irradiation. Higher laser energy (0.7 mJ/cm2 to 25 mJ/cm2) increases the number of small particle formation. The solid curve is a fit to a distribution function (normal or lognormal) with the corresponding mean and standard deviation. The value of N denotes the number of particles analyzed to generate the histogram. (D) Schematic for modeling extinction spectrum change induced by AuNP size reduction. The initial particle (dNP) will fragment into a large daughter particle (dlarge) and many small daughter particles (dsmall) (E) The size distribution of 100 nm AuNPs after laser treatment when 1% of particles are fragmented. (F) Contributions of small particles (psmall∙Cext_small) and large particles(plarge∙Cext_large) to collective extinction (Cext_mix). p is the number percentage of the corresponding population. (G-H) Experimental and predicted extinction spectra before and after laser fragmentation. (I-J) The extinction ratio maps from experiment and Mie theory calculation. The blue and red color correspond to the decrease and increase of the absorption ratio at the wavelength set relative to the original sample. The experimental and computed extinction ratio maps show qualitative similarity, demonstrating that we could recover the spectral changes resulting from the nanoparticle fragmentation under ps laser.
