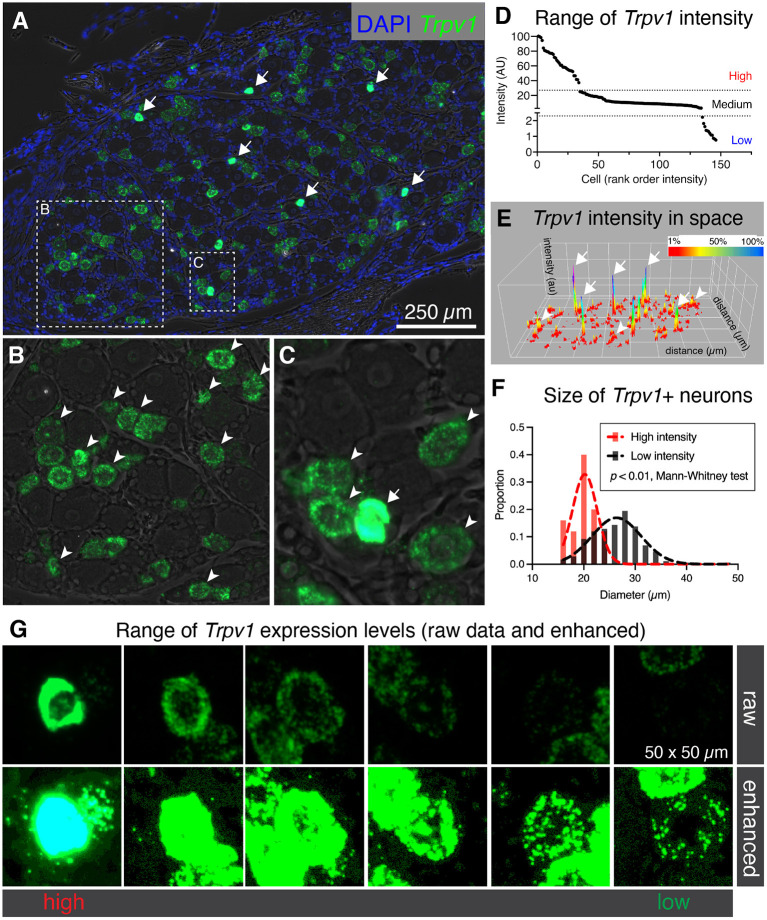
Figure 2.
Heterogeneous labeling of Trpv1 mRNA in rat dorsal root ganglion (DRG). (A) Fluorescent in situ hybridization was performed and imaged for whole rat DRG sections (N = 3). Very high levels of expression were observed in a small number of small diameter neurons (white arrows). (B) An enlargement of a neuron-rich region is shown with Trpv1+ neurons (arrowheads). (C) A second enlargement includes one high-expressing Trpv1+ neuron (arrow) and several other Trpv1+ neurons with moderate staining intensity (arrowheads). (D) Intensity values for Trpv1 were plotted by rank order. Based on these values, Trpv1 expression was divided into high, medium and low expression. (E) A surface plot was generated for Trpv1 intensity (arbitrary units, Z-axis) across the entire DRG section shown in (A). This plot shows the relationship between the high-expressing Trpv1 DRG neurons and other cells in the ganglion. Note the high peaks indicating a quantitatively separate population (white arrows). (F) Diameter of the high intensity Trpv1+ neurons was examined by measuring the area in Fiji. High intensity Trpv1+ neurons had a stereotyped small diameter as represented by the narrow Gaussian (red) relative to the broader distribution of medium/low Trpv1+ neurons (black Gaussian). This difference was significant based on a Mann-Whitney test (p < 0.01). (G) Representative fields of 6 Trpv1+ DRG neurons are shown, spanning a range of expression levels. Scanning parameters are tuned so as not to saturate the brightest cells. Note that the range of expression values is such that when the lower expressing Trpv1+ neurons are visible, the highest cells are saturated.

