Figure 4.
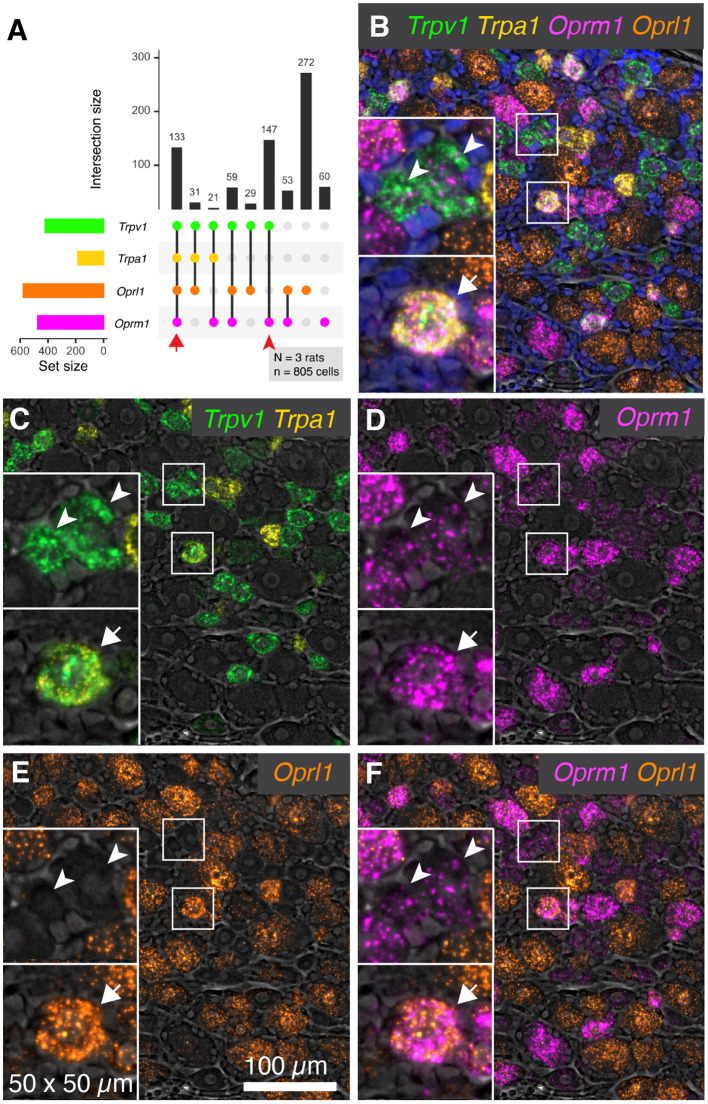
Co-expression patterns of nociceptive ion channels and opioid receptors. To assess the overlap between nociceptive transducing ion channels and opioid receptors, multiplex fluorescent hybridization was performed for Trpv1, Trpa1, Oprm1 and Oprl1. This analysis was performed in N = 3 rats total, and 805 cells. (A) Counts were tabulated for co-expression of these four markers in each cell, and the intersections of these are plotted. The most prevalent count group was Oprl1 alone, due to the near-ubiquitous nature of this marker (272 cells). Cells positive for all four labels (133 cells) were also prevalent, indicating overlap between nociceptive ion channels (Trpv1 and Trpa1) and the mu-opioid receptor Oprm1 as well as Oprl1. Populations containing Trpv1 and Oprm1 with or without Oprl1 (59 cells with all three and 147 cells with Trpv1/Oprm1 only) were also prevalent, reinforcing the overlap between these two markers. (B) A representative panel showing a diverse field of cells is shown, with quad-positive neurons highlighted (arrows). Additionally, Trpv1+/Oprm1+ cells are indicated (arrowheads). (C–F) To increase the visibility of the highly multiplexed image, individual channels and channel pairs are shown for the image in (B), with the channel identity found in the bottom right of each panel. (C) A panel showing only Trpv1 and Trpa1 was selected to show the relationship between these two nociceptive ion channels. (D) A range of intensities was observed for Oprm1. Note the presence of less prominent puncta in Trpv1+/Oprm1+ cells (arrowheads). (E) Oprl1 alone. (F) Oprm1 and Oprl1. Scale bar applies to all images.

